Deploying Filebeat in docker
Learn about Filebeat and how it interact with the rest of the Elastic Stack components while you deploy it using docker.
What you’ll need
- About 30 minutes
- Docker Desktop for you operating system already installed. For this tutorial, we used Docker Desktop for Windows. You can download it from here.
Introduction to Filebeat
Filebeat is part of Elastic Stack Beat. With this Beat, you can monitor your log files or the paths that you specify, collect log events and send them to either Elasticsearch for indexing or Logstash for enriching them.
But, how does Filebeat exactly works? When this Beat is started, it looks for logs in the locations that you specified. This location is known as an input. For each log that it finds, it starts a harvester. In other words, an input is responsible for managing the harvesters and finding all sources to read from, while a harvester is responsible for reading the content of a single file. The harvester reads each file, line by line, and sends the content to the output.
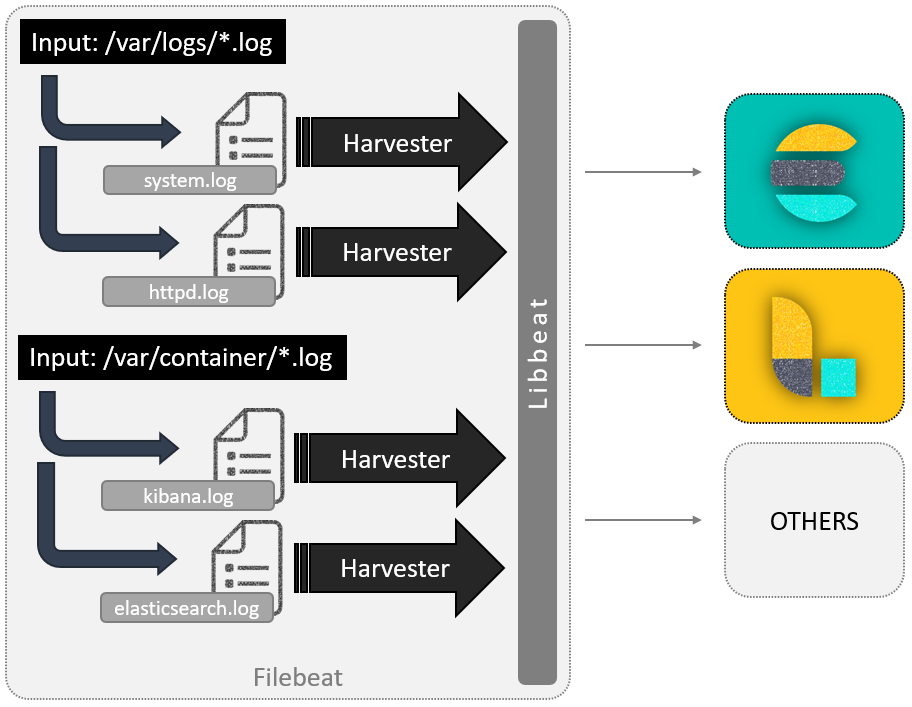
The harvester output is libbeat, which aggregates the events and sends the aggregated data to the output that you’ve configured for Filebeat.
libbeat is a framework for building Beats written in Go and containing the common packages for all the Beats.
Deploying Filebeat in Docker
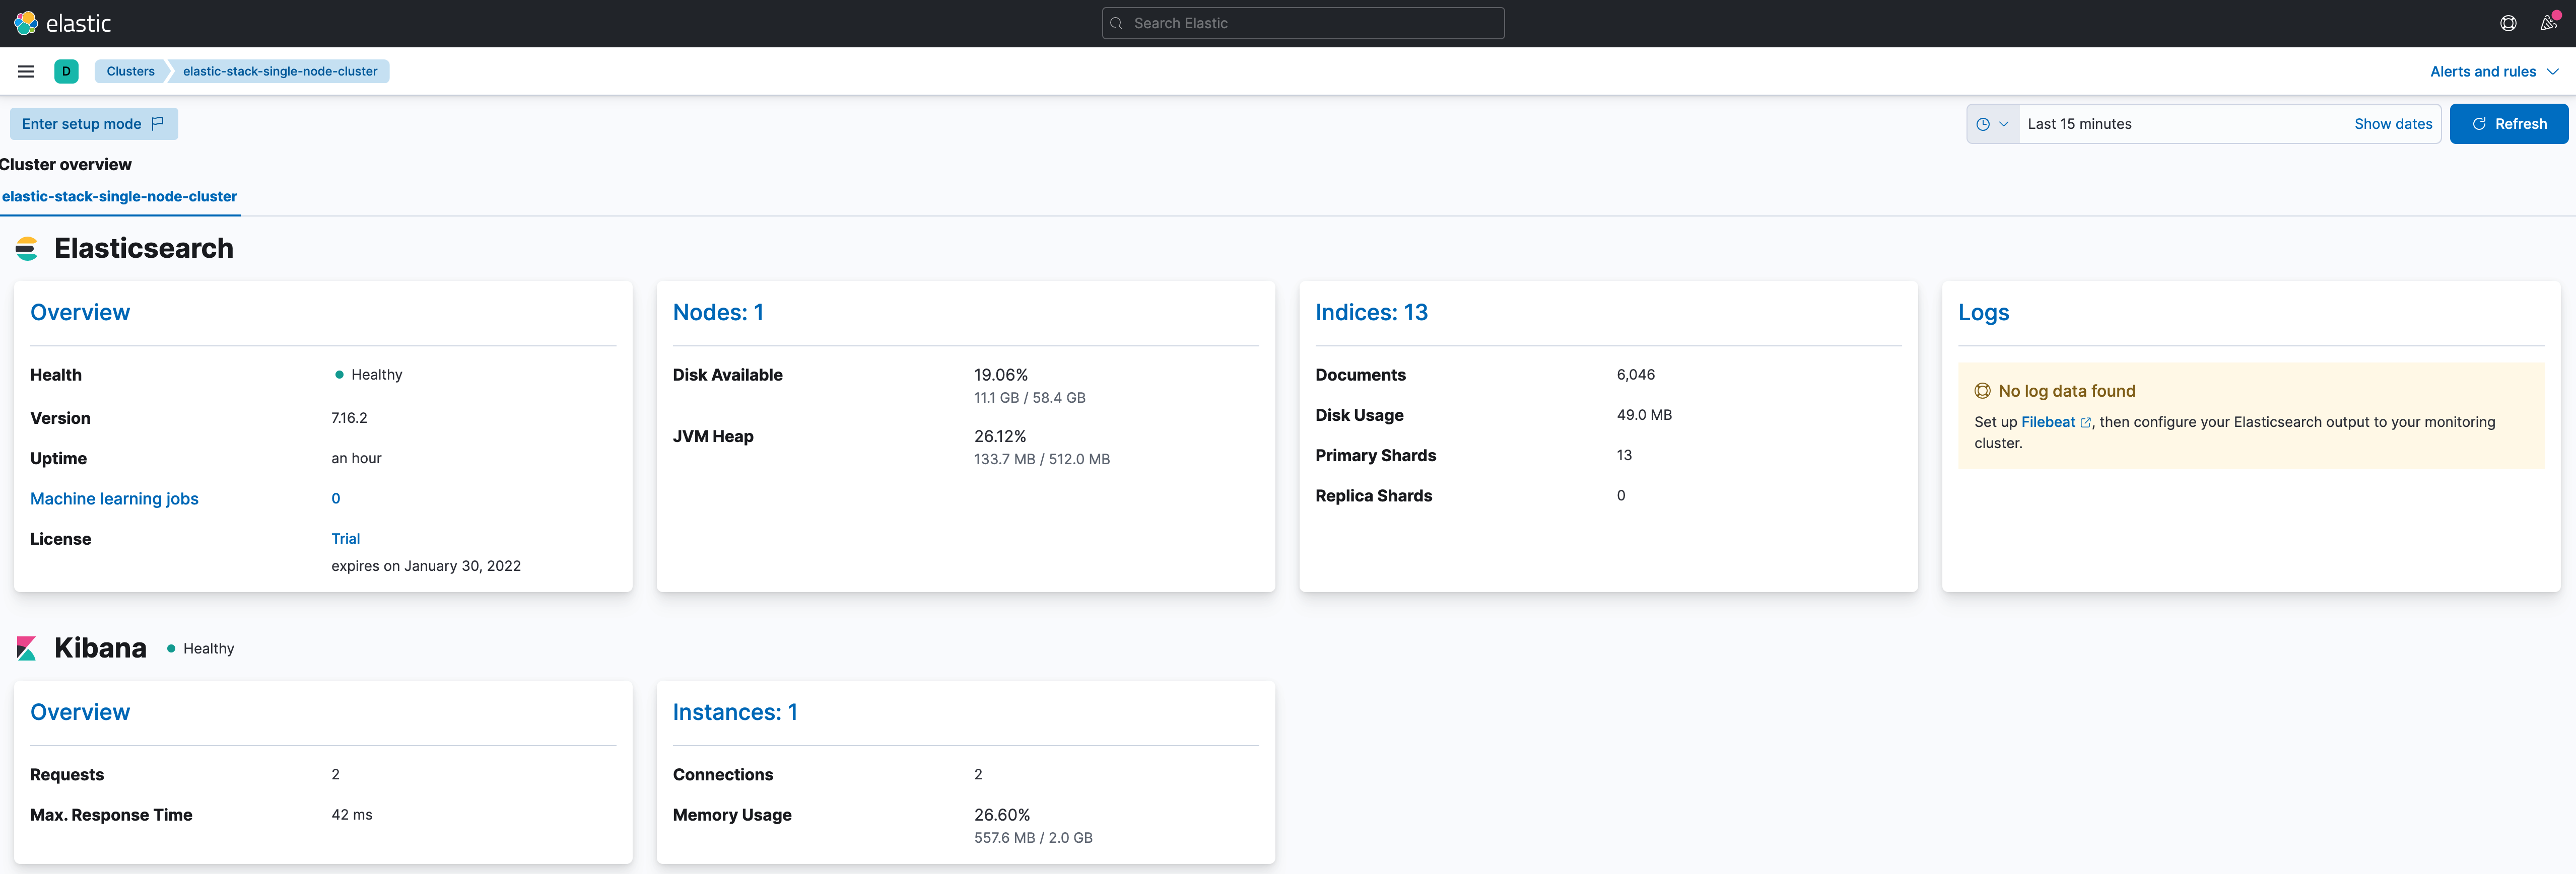
So far, we already have deployed Elasticsearch and Kibana. If you navigate to Management > Stack Monitoring, you can see the status of your cluster. After we deploy Filebeat, we will be able to monitor it from here too.
Let’s start by adding a folder which will have Filebeat’s files. The changes in the project should be highlighted.
elastic-stack-demo
  +- elasticsearch-single-node-cluster
       +- elasticsearch
       |    +- Dockerfile-elasticsearch-single-node
       |    +- elasticsearch-single-node.yml
       +-filebeat
       |    +- Dockerfile
       |    +- filebeat-to-elasticsearch.yml
       +-kibana
       |    +- Dockerfile-kibana-single-node
       |    +- kibana-single-node.yml
       +- .env
       +- docker-compose-es-single-node.yml
       +- docker-compose-filebeat-to-elasticseach.yml
The first file we will be creating is the Dockerfile. Created it under elastic-stack-single-node-cluster/filebeat/, and paste the following code:
ARG ELK_VERSION
FROM docker.elastic.co/beats/filebeat:${ELK_VERSION}

ARG FILEBEAT_CONFIG

# add custom configuration
COPY --chown=root:filebeat ${FILEBEAT_CONFIG}.yml /usr/share/filebeat/filebeat.yml
You might notice that we have passed the name of Filebeat’s configuration file as argument. This is because Filebeat can be configured in several ways, and in upcoming posts, we will be explaining these options. So, we have decided to parameterize it.
Next, we need the configuration file. Since for now, we will send the collected data directly to Elasticsearch, we will call the YAML file like filebeat-to-elasticsearch.yml. Here is the code you will need:
######################## Filebeat Configuration ############################
# You can find the full configuration reference here:
# https://www.elastic.co/guide/en/beats/filebeat/index.html

# ========================== Filebeat global options ===========================
# Enable filebeat config reloading
filebeat.config:
  modules:
    path: ${path.config}/modules.d/*.yml
    reload.enabled: false

# =========================== Filebeat autodiscover ============================
# Autodiscover allows you to detect changes in the system and spawn new modules
# or inputs as they happen.
filebeat.autodiscover:
  # List of enabled autodiscover providers
  providers:
    - type: docker
      hints.enabled: true

# ================================= Processors =================================
# Processors are used to reduce the number of fields in the exported event or to
# enhance the event with external metadata. This section defines a list of
# processors that are applied one by one and the first one receives the initial
# event:
#
#   event -> filter1 -> event1 -> filter2 ->event2 ...
#
# The supported processors are drop_fields, drop_event, include_fields,
# decode_json_fields, and add_cloud_metadata.
processors:
  # The following example enriches each event with docker metadata, it matches
  # container id from log path available in `source` field (by default it expects
  # it to be /var/lib/docker/containers/*/*.log).
  - add_docker_metadata: ~
  # The following example enriches each event with host metadata.
  - add_host_metadata: ~

# ================================== Outputs ===================================
# Configure what output to use when sending the data collected by the beat.
# ---------------------------- Elasticsearch Output ----------------------------
output.elasticsearch:
  # Boolean flag to enable or disable the output module.
  enabled: true
  # Array of hosts to connect to.
  # Scheme and port can be left out and will be set to the default (http and 9200)
  # In case you specify and additional path, the scheme is required: http://localhost:9200/path
  # IPv6 addresses should always be defined as: https://[2001:db8::1]:9200
  hosts: ['elasticsearch-demo:9200']

# ================================= Dashboards =================================
# These settings control loading the sample dashboards to the Kibana index. Loading
# the dashboards are disabled by default and can be enabled either by setting the
# options here, or by using the `-setup` CLI flag or the `setup` command.
setup.dashboards.enabled: true

# =================================== Kibana ===================================
# Starting with Beats version 6.0.0, the dashboards are loaded via the Kibana API.
# This requires a Kibana endpoint configuration.
setup.kibana:
  # Kibana Host
  # Scheme and port can be left out and will be set to the default (http and 5601)
  # In case you specify and additional path, the scheme is required: http://localhost:5601/path
  # IPv6 addresses should always be defined as: https://[2001:db8::1]:5601
  host: "kibana-demo:5601"

# ================================== Logging ===================================
# There are four options for the log output: file, stderr, syslog, eventlog
# The file output is the default.
# Sets log level. The default log level is info.
# Available log levels are: error, warning, info, debug
logging.level: info

# Write Filebeat own logs only to file to avoid catching them with itself in docker log files
# When true, writes all logging output to files. The log files are automatically rotated when the
# log file size limit is reached.
logging.to_files: false

# When true, writes all logging output to the syslog. This option is not supported on Windows.
logging.to_syslog: false

# ============================= X-Pack Monitoring ==============================
# Filebeat can export internal metrics to a central Elasticsearch monitoring
# cluster.  This requires xpack monitoring to be enabled in Elasticsearch.  The
# reporting is disabled by default.

# Set to true to enable the monitoring reporter.
monitoring.enabled: true

# Uncomment to send the metrics to Elasticsearch. Most settings from the
# Elasticsearch output are accepted here as well.
# Note that the settings should point to your Elasticsearch *monitoring* cluster.
# Any setting that is not set is automatically inherited from the Elasticsearch
# output configuration, so if you have the Elasticsearch output configured such
# that it is pointing to your Elasticsearch monitoring cluster, you can simply
# uncomment the following line.
monitoring.elasticsearch:
  # Array of hosts to connect to.
  # Scheme and port can be left out and will be set to the default (http and 9200)
  # In case you specify and additional path, the scheme is required: http://localhost:9200/path
  # IPv6 addresses should always be defined as: https://[2001:db8::1]:9200
  #hosts: ["elasticsearch-demo:9200"]

# =============================== HTTP Endpoint ================================
# Each beat can expose internal metrics through a HTTP endpoint. For security
# reasons the endpoint is disabled by default. This feature is currently experimental.
# Stats can be access through http://localhost:5066/stats . For pretty JSON output
# append ?pretty to the URL.
# Defines if the HTTP endpoint is enabled.
http.enabled: true

# The HTTP endpoint will bind to this hostname, IP address, unix socket or named pipe.
# When using IP addresses, it is recommended to only use localhost.
http.host: filebeat-to-elasticseach-demo

# Port on which the HTTP endpoint will bind. Default is 5066.
http.port: 5066
As you can see, we have included the description of each configuration option. Hopefully, it will be easier to understand it. However, the main idea behind it, is:
- Enable the autodiscover feature, based on hints. Autodiscover allows you to track applications and monitor services as they start running. The hints system looks for hints in Kubernetes Pod annotations or Docker labels that have the prefix
co.elastic.logs. As soon as the container starts, Filebeat will check if it contains any hints and launch the proper config for it. - Enable providers, which work by watching for events on the system and translating those events into internal autodiscover events with a common format.
- Send the collected data to Elasticsearch for indexing.
- Automatically create predefined dashboards and load them into Kibana.
- Export internal metrics to a central Elasticsearch monitoring cluster, by enabling x-pack monitoring. In our case, we will be using the same cluster.
- Enable experimental HTTP endpoint, which exposes internal metrics.
Now, we create a separate docker-compose file under elastic-stack-single-node-cluster/ and name it docker-compose-filebeat-to-elasticseach.yml.
version: '3.9'
services:
  filebeat-to-elasticseach-demo:
    hostname: filebeat-to-elasticseach-demo
    container_name: filebeat-to-elasticseach-demo
    build:
      context: ./filebeat
      dockerfile: Dockerfile
      args:
        - ELK_VERSION=${ELK_VERSION}
        - FILEBEAT_CONFIG=filebeat-to-elasticseach
    ports:
      - 5166:5066
    # Need to override user so we can access the log files, and docker.sock
    user: root
    volumes:
      - /var/run/docker.sock:/var/run/docker.sock:ro
      # This is needed for filebeat to load container log path as specified in filebeat.yml
      - /var/lib/docker/containers/:/var/lib/docker/containers/:ro
      # This is needed for filebeat to load logs for system and auth modules
      - /var/log/:/var/log/:ro
    # disable strict permission checks
    command: [ '-e', '-v', '--strict.perms=false' ]
    networks:
      - elastic-stack-service-network

# Networks to be created to facilitate communication between containers
networks:
  elastic-stack-service-network:
    name: elastic-stack-service-network
For demostration and testing purposes, we are disabling strict permission checks from the command line by using --strict.perms=false, but we strongly encourage you to leave the checks enabled. Specially in production environments.
In addition, see that the Docker logs host folder (/var/lib/docker/containers) is mounted on the Filebeat container too.
We are almost done. The last thing we need to do, is add labels to Elasticsearch and Kibana services in our docker-compose-es-single-node.yml file. The file should look like this (see highlighted lines):
version: '3.9'
services:
  elasticsearch-demo:
    hostname: elasticsearch-demo
    container_name: elasticsearch-demo
    build:
      context: ./elasticsearch
      dockerfile: Dockerfile-single-node
      args:
        - ELK_VERSION=${ELK_VERSION}
      labels:
        co.elastic.logs/module: "elasticsearch"
    ports:
      - 9300:9300
      - 9200:9200
    volumes:
      - data_es_demo:/usr/share/elasticsearch/data:rw
    environment:
      - "ES_JAVA_OPTS=-Xms512m -Xmx512m"
    ulimits:
      memlock:
        soft: -1
        hard: -1
    networks:
      - elastic-stack-service-network

  kibana-demo:
    hostname: kibana-demo
    container_name: kibana-demo
    build:
      context: ./kibana
      dockerfile: Dockerfile-single-node
      args:
        - ELK_VERSION=${ELK_VERSION}
      labels:
        co.elastic.logs/module: "kibana"
    ports:
      - 5601:5601
    networks:
      - elastic-stack-service-network

# Networks to be created to facilitate communication between containers
networks:
  elastic-stack-service-network:
    driver: bridge

# Volumes
volumes:
  data_es_demo:
    driver: local
We are finally ready to start Filebeat. To do so, execute the following commands:
$ cd elastic-stack-demo/elastic-stack-single-node-cluster

$ docker-compose -f docker-compose-filebeat-to-elasticseach.yml up -d
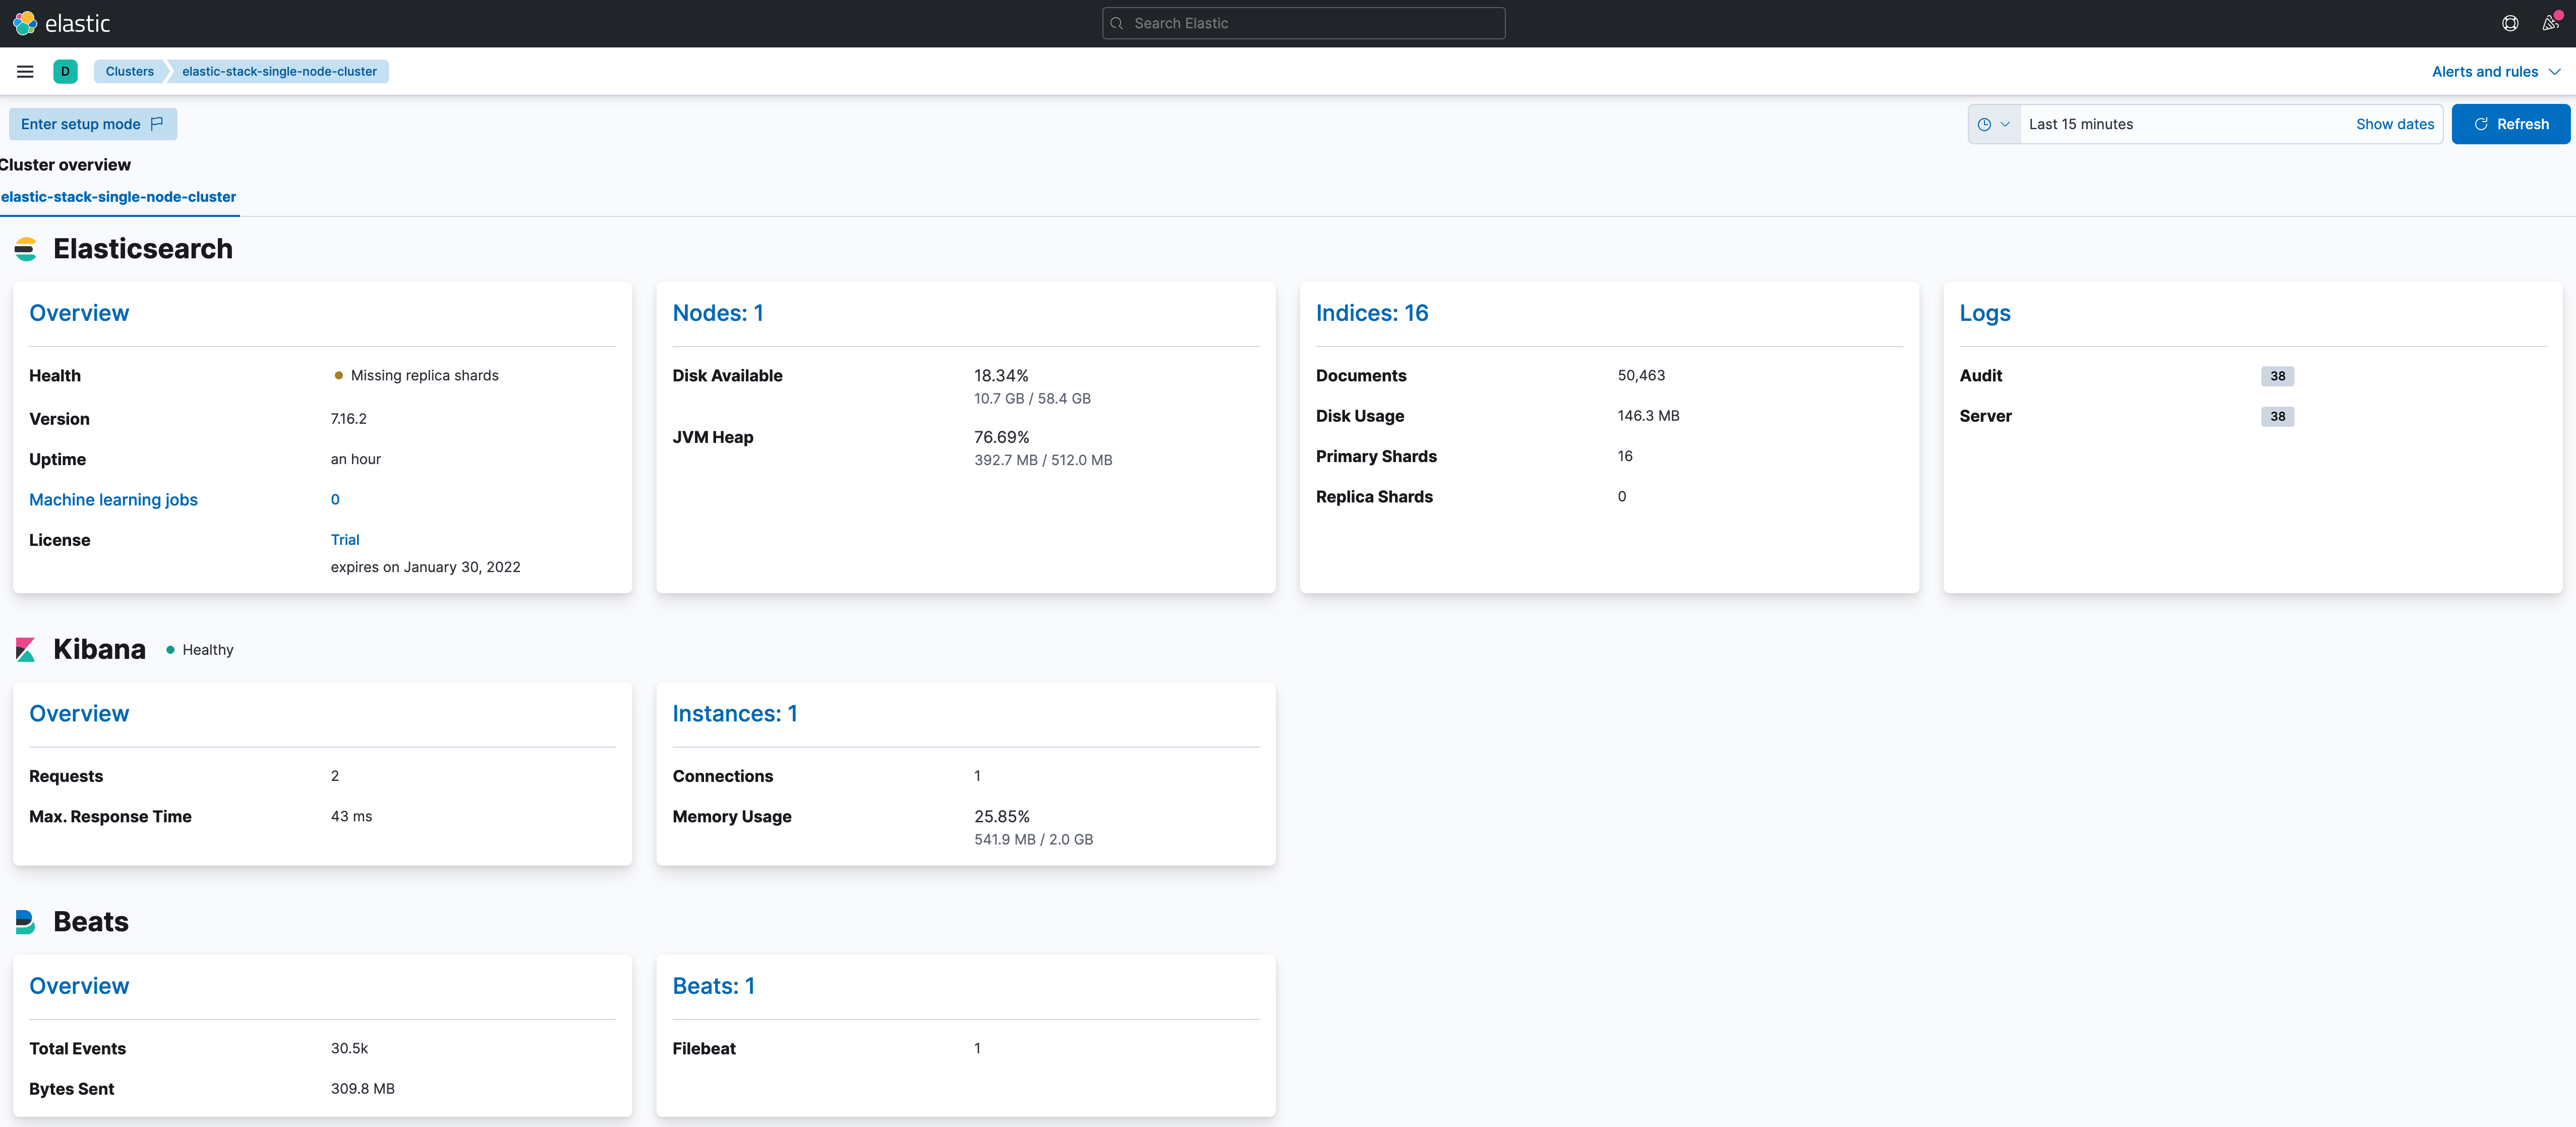
Once up, wait for a while and than navigate to Management > Stack Monitoring. You should see the status of your cluster, and a new section that includes the status of your Beats, as well as a summary of the logs registered by monitoring your cluster.
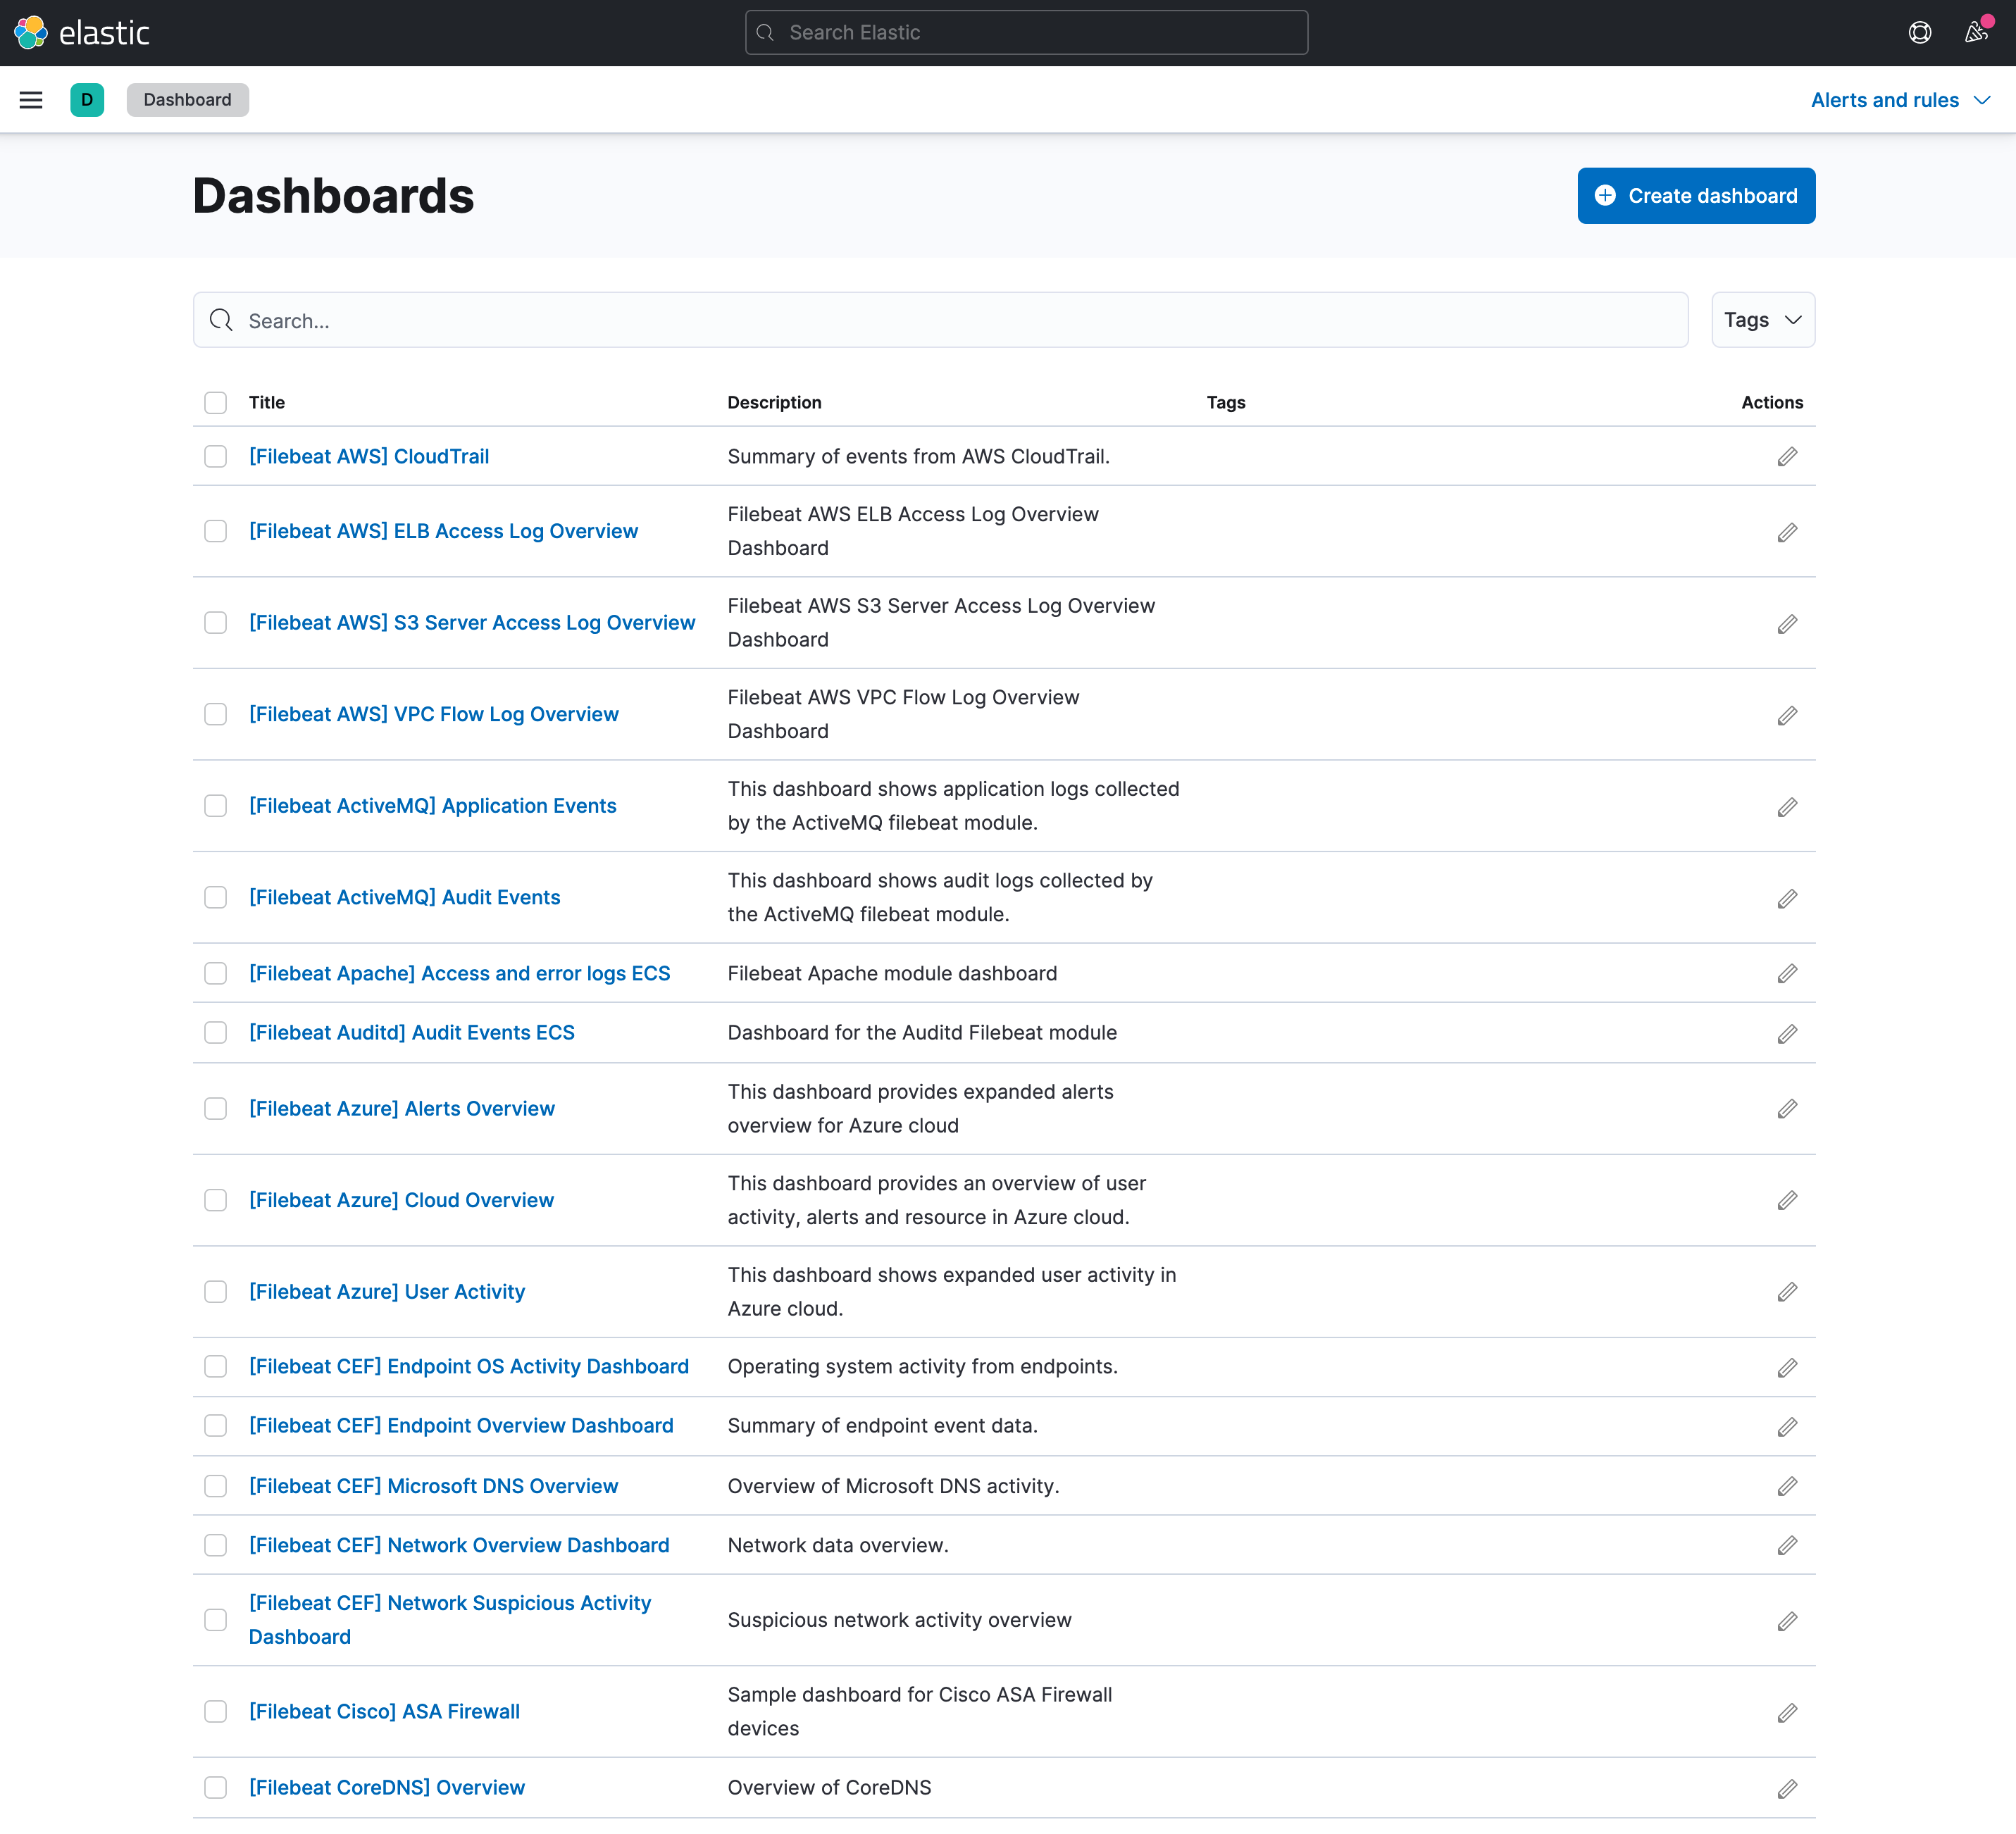
Then, visit the Analytics > Dashboard section. You should see a list of dashboards that were automatically created by Filebeat when it was started.
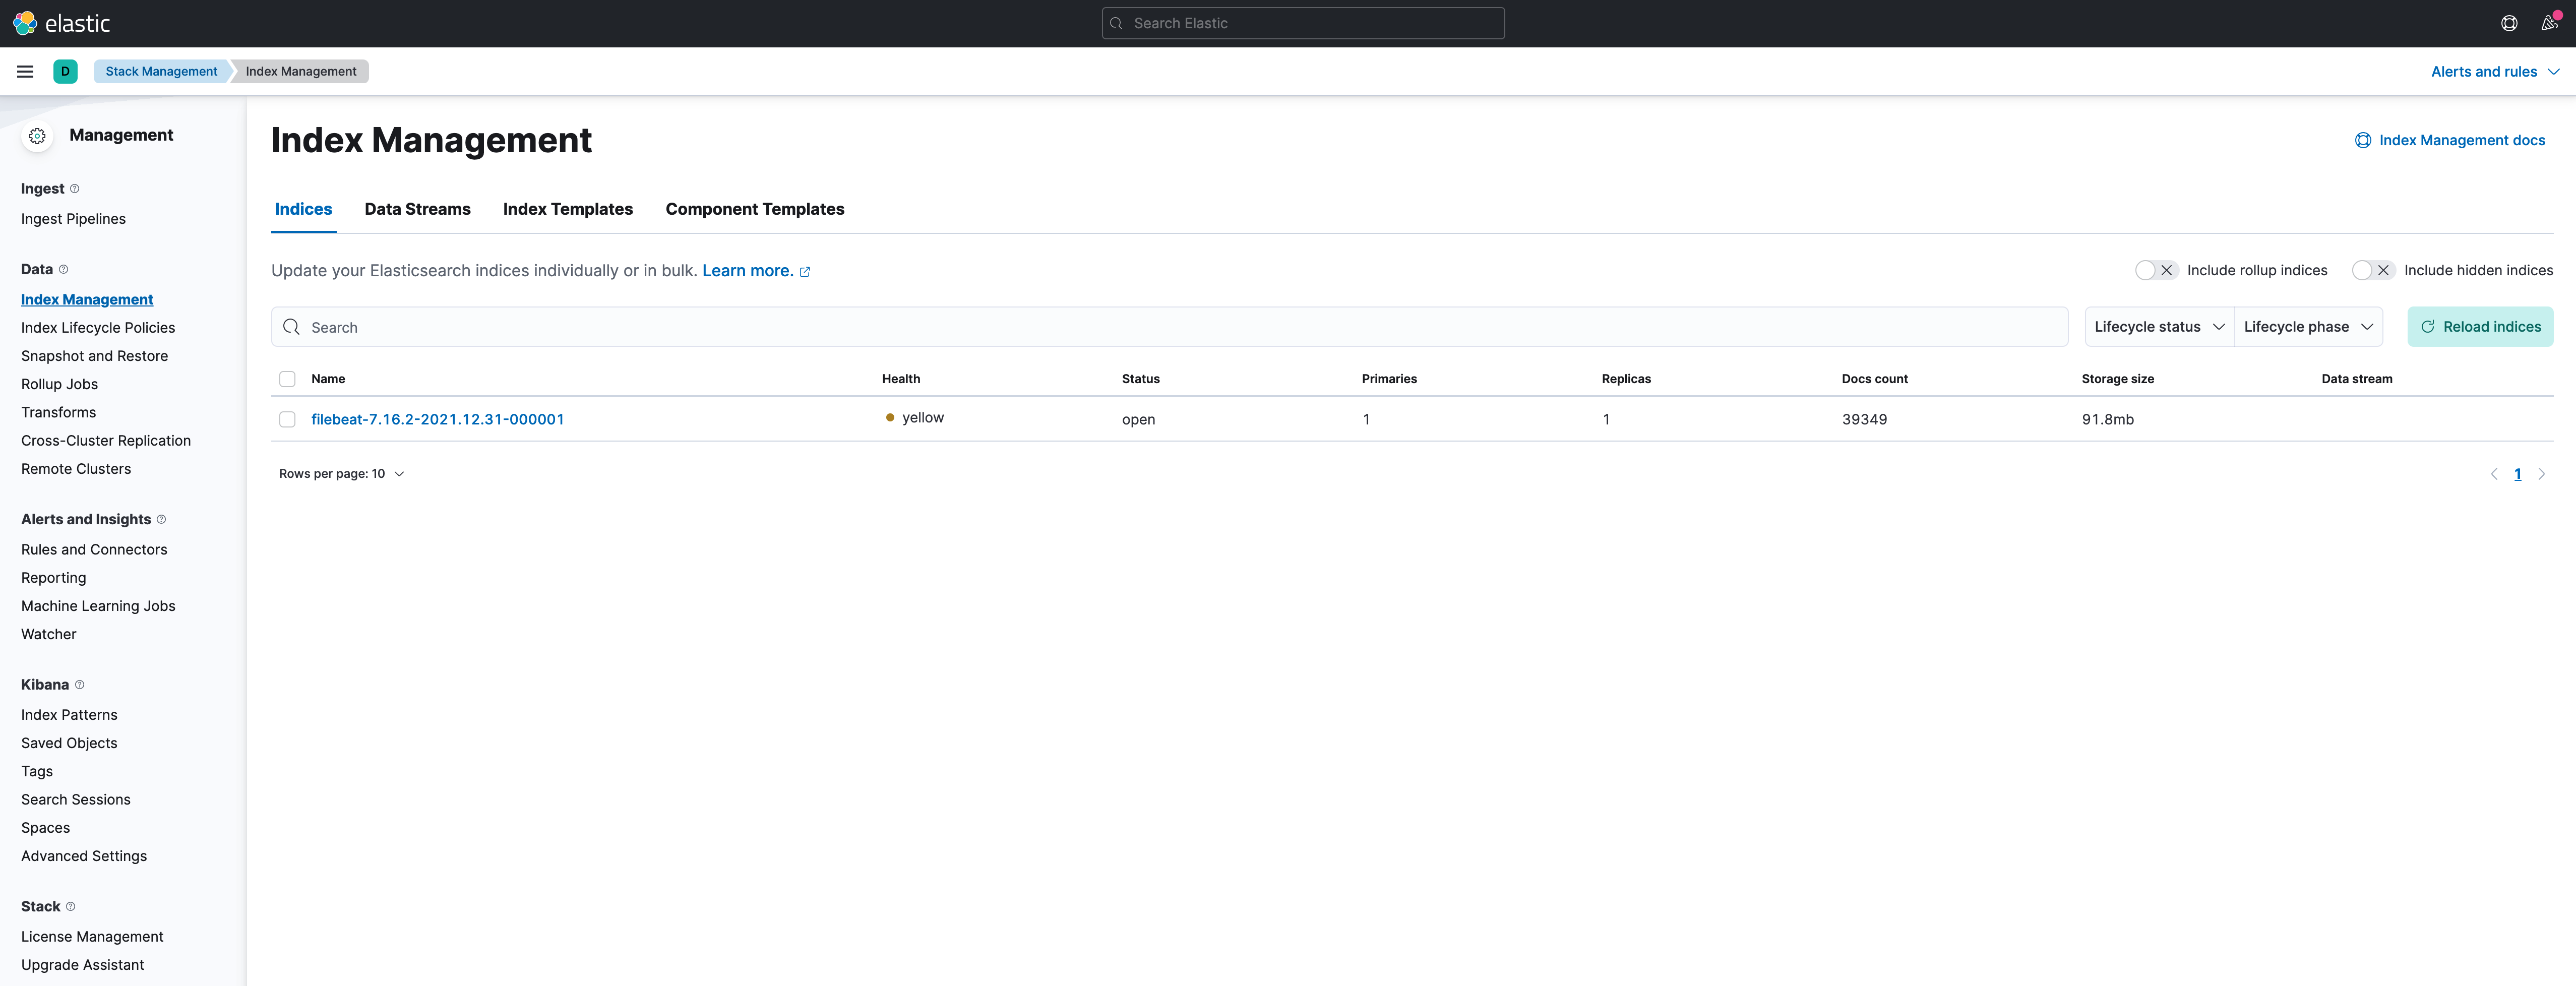
One last check, visit Stack Management > Index Management. You should see an index which name starts with filebeat.
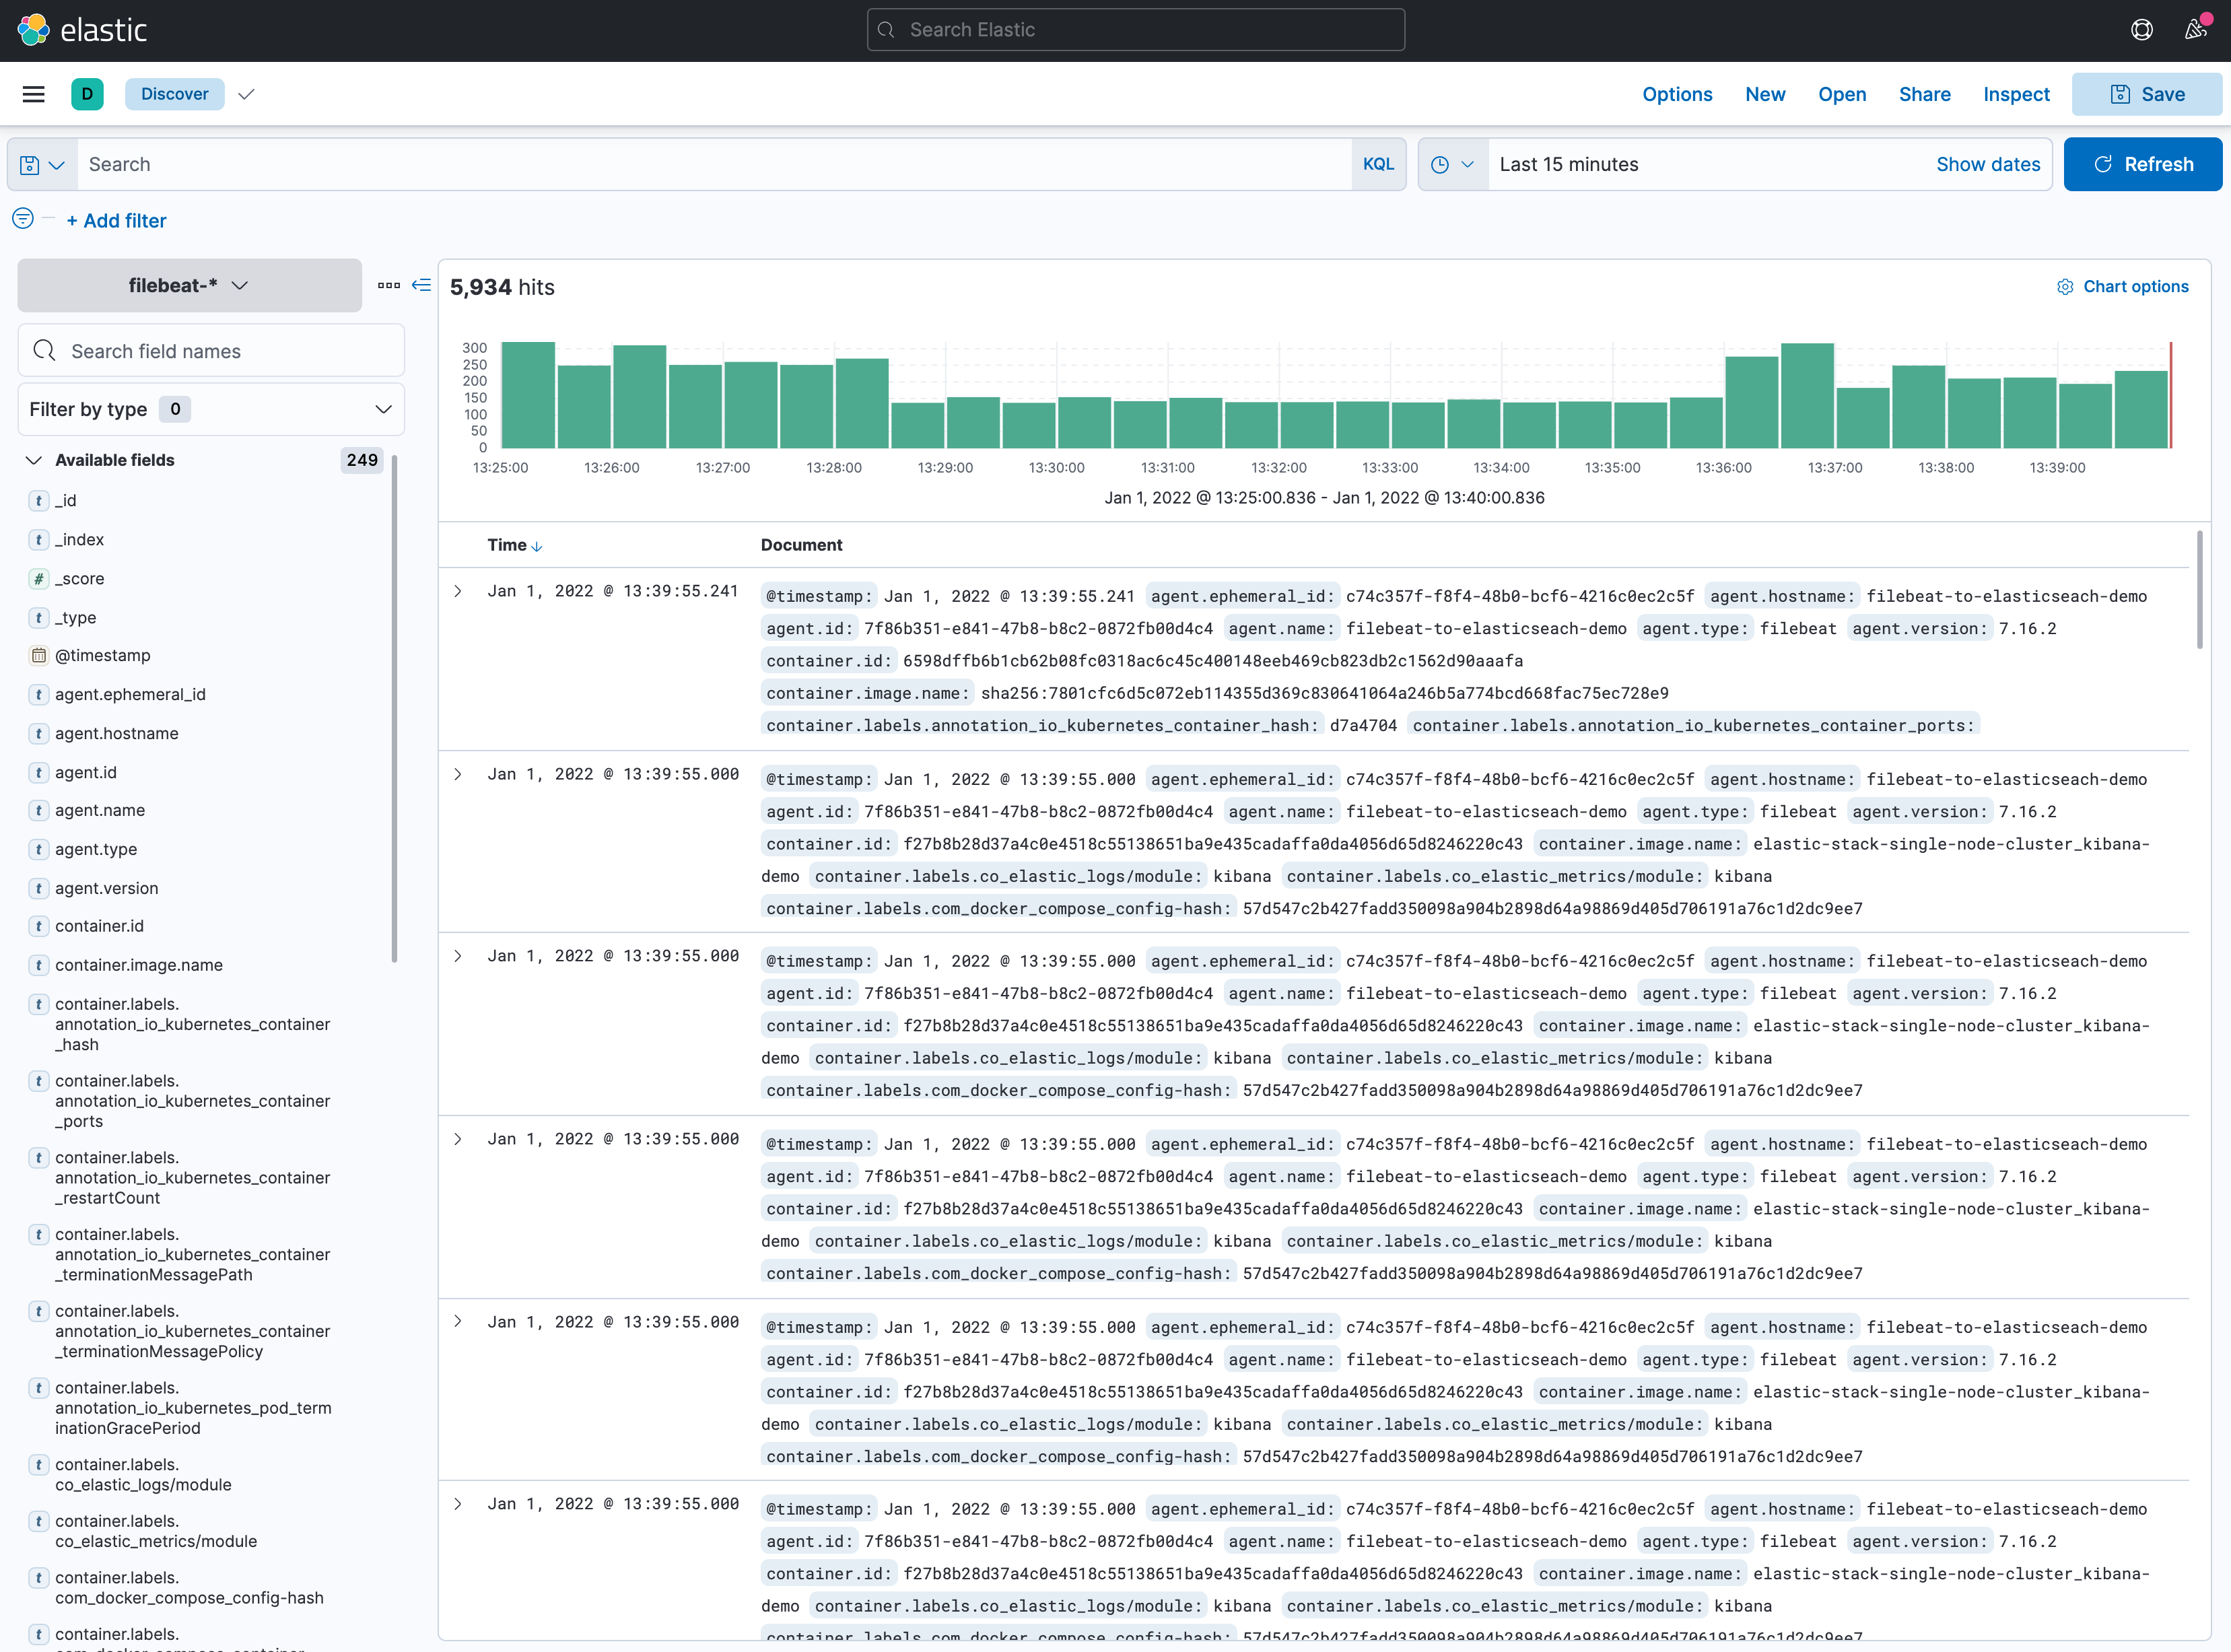
If you would like to see the indexed logs, go to Analytics > Discover.
Thats it. We are done. In the following posts, we will be deploying some other Beats.
Clean Up
To do a complete clean up, execute this command:
$ docker-compose -f docker-compose-es-single-node.yml -f docker-compose-filebeat-to-elasticseach.yml down -v
[+] Running 5/5
 ⠿ Container filebeat-to-elasticseach-demo                                  Removed                                                                                                                                                                                                                              0.5s
 ⠿ Container elasticsearch-demo                                             Removed                                                                                                                                                                                                                              3.9s
 ⠿ Container kibana-demo                                                    Removed                                                                                                                                                                                                                             11.3s
 ⠿ Volume elastic-stack-single-node-cluster_data_es_demo                    Removed                                                                                                                                                                                                                              0.6s
 ⠿ Network elastic-stack-single-node-cluster_elastic-stack-service-network  Removed
Summary
In this post, we have deployed Filebeat in a dockerized environment, using hints with autodiscover to monitor Elasticsearch and Kibana. We hope that this basic guide can be useful for you, and that at least it can be a starting point. We will try to go deeper into Elastic Stack in upcoming posts.
Please feel free to contact us. We will gladly response to any doubt or question you might have. In the mean time, you can download the source code from our official GitHub repository.