Deploying Elastic Stack Cluster (single node) in docker
Hello my friends! It has been a while, but finally it is here. Let us show you how to deploy a single node Elastic Stack cluster using docker. Hope you find in it useful!
What you’ll need
- About 30 minutes
- Docker Desktop for you operating system already installed. For this tutorial, we used Docker Desktop for Windows. You can download it from here.
Introduction
In our previous post, we gave a brief introduction to Elastic Stack and all its components. However, in this tutorial, we will learn how easy it is to deploy it in docker. We will start by just deploying Elasticsearch in a single node cluster. Once up, we will deploy Kibana. For now, that is all. In the following posts, we wil deploy other components that will interact with our cluster.
We will deploy Elastic Stack in 3 simple steps. But first, here is the folder structure that we will use:
elastic-stack-demo
  +- elasticsearch-single-node-cluster
       +- elasticsearch
       |    +- Dockerfile-elasticsearch-single-node
       |    +- elasticsearch-single-node.yml
       +-kibana
       |    +- Dockerfile-kibana-single-node
       |    +- kibana-single-node.yml
       +- .env
       +- docker-compose-es-single-node.yml
In order to have more flexibility when configuring both Elasticsearch and Kibana, we have created a specific Dockerfile and YAML file.
1. Create .env File and docker-compose-es-single-node.yml file
We start by creating a .env. This is a very simple file that will help us declare environment variables used inside our containers. Here is our .env file:
COMPOSE_PROJECT_NAME=elastic-stack-single-node-cluster
ELK_VERSION=7.16.2
As you can see, we will be using Elastic Stack’s version 7.16.2, which is the latest version at the moment, and which fixes Log4j2 vulnerability, as it uses Log4J released 2.17.0 version with fixes for CVE-2021-45046 and CVE-2021-45105.
Next, create a new docker-compose-es-single-node.yml file inside elasticsearch-single-node-cluster directory, and add the following code:
version: '3.9'
services:
  # Add here elasticsearch's service configuration

  # Add here kibana's service configuration

# Networks to be created to facilitate communication between containers
networks:
  elastic-stack-service-network:
    name: elastic-stack-service-network

# Volumes
volumes:
  data_es_demo:
    driver: local
2. Add Elasticsearch
At the center of Elastic Stack, we find Elasticsearch. As explained, Elasticsearch is a distributed search and analytics engine, which provides near real-time search and analytics for all types of data. Whether you have structured or unstructured text, numerical data, or geospatial data, Elasticsearch can efficiently store and index it in a way that supports fast searches.
We start by creating the Dockerfile and YAML file specific for Elasticsearch. Add a new Dockerfile inside /elasticsearch-single-node-cluster/elasticsearch directory, and name it Dockerfile-elasticsearch-single-node.
ARG ELK_VERSION
FROM docker.elastic.co/elasticsearch/elasticsearch:${ELK_VERSION}

# add custom configuration
ADD --chown=elasticsearch:root elasticsearch-single-node.yml /usr/share/elasticsearch/config/elasticsearch.yml
Now, create a new YAML file and name it elasticsearch-single-node.yml. The file should be created inside /elasticsearch-single-node-cluster/elasticsearch directory, and include the following:
# ---------------------------------- Cluster -----------------------------------
# Cluster name identifies your cluster for auto-discovery. If you're running
# multiple clusters on the same network, make sure you're using unique names.
cluster.name: elastic-stack-single-node-cluster

# Specifies whether Elasticsearch should form a multiple-node cluster. By default,
# Elasticsearch discovers other nodes when forming a cluster and allows other nodes
# to join the cluster later. If discovery.type is set to single-node, Elasticsearch
# forms a single-node cluster and suppresses the timeout set by cluster.publish.timeout.
discovery.type: single-node

# ---------------------------------- Network -----------------------------------
# Sets the address of this node for both HTTP and transport traffic. The node will
# bind to this address and will also use it as its publish address. Accepts an IP
# address, a hostname, or a special value.
network.host: 0.0.0.0

# ------------------------------------ Node ------------------------------------
# Node names are generated dynamically on startup, so you're relieved
# from configuring them manually. You can tie this node to a specific name:
node.name: "elasticsearch-demo-single-node"

# ----------------------------------- Memory -----------------------------------
# Lock the memory on startup
bootstrap.memory_lock: true

# ----------------------------------- License -----------------------------------
# Set to basic (default) to enable basic X-Pack features. If set to trial, the
# self-generated license gives access only to all the features of a x-pack for 30
# days. You can later downgrade the cluster to a basic license if needed.
xpack.license.self_generated.type: trial

# -----------------------------------  Monitoring -----------------------------------
# Set to true to enable the collection of monitoring data. When this setting is false
# (default), Elasticsearch monitoring data is not collected and all monitoring data from
# other sources such as Kibana, Beats, and Logstash is ignored.
xpack.monitoring.collection.enabled: true

# Controls whether statistics about your Elasticsearch cluster should be collected.
# Defaults to true. This is different from xpack.monitoring.collection.enabled, which
# allows you to enable or disable all monitoring collection. However, this setting simply
# disables the collection of Elasticsearch data while still allowing other data (e.g.,
# Kibana, Logstash, Beats, or APM Server monitoring data) to pass through this cluster.
xpack.monitoring.elasticsearch.collection.enabled: true

# ----------------------------------- Minimal Security -----------------------------------
# Set to true to enable Elasticsearch security features on the node. If set to false, which
# is the default value for basic and trial licenses, security features are disabled. It also
# affects all Kibana instances that connect to this Elasticsearch instance; you do not need
# to disable security features in those kibana.yml files. For more information about disabling
# security features in specific Kibana instances, see Kibana security settings.
xpack.security.enabled: false
We tried to include a brief description of each configuration parameter.
Add Elasticsearch’s service to docker-compose-es-single-node.yml file by adding the following code:
version: '3.9'
services:
  elasticsearch-demo:
    hostname: elasticsearch-demo
    container_name: elasticsearch-demo
    build:
      context: ./elasticsearch
      dockerfile: Dockerfile-single-node
      args:
        - ELK_VERSION=${ELK_VERSION}
    ports:
      - 9300:9300
      - 9200:9200
    volumes:
      - data_es_demo:/usr/share/elasticsearch/data:rw
    environment:
      - "ES_JAVA_OPTS=-Xms512m -Xmx512m"
    ulimits:
      memlock:
        soft: -1
        hard: -1
    networks:
      - elastic-stack-service-networkork
 # Add here kibana's service configuration

# Networks to be created to facilitate communication between containers
networks:
  elastic-demo-service-network:
    driver: bridge
    name: demo-network

# Volumes
volumes:
  data_es_demo:
    driver: local
Aside from adding Elasticsearch service, we are creating a volume so that Elasticsearch can persist the data that it indexes.
3. Add Kibana’s Container
Kibana enables users to give shape to their data and navigate the Elastic Stack. With Kibana, users can:
- Search, observe, and protect. From discovering documents to analyzing logs to finding security vulnerabilities, Kibana is your portal for accessing these capabilities and more.
- Analyze your data. Search for hidden insights, visualize what you’ve found in charts, gauges, maps, graphs, and more, and combine them in a dashboard.
- Manage, monitor, and secure the Elastic Stack. Manage your data, monitor the health of your Elastic Stack cluster, and control which users have access to which features.
Again, we begin by creating the Dockerfile and YAML file specific for Kibana. Add a new Dockerfile inside /elasticsearch-single-node-cluster/kibana directory, and name it Dockerfile-kibana-single-node.
ARG ELK_VERSION
FROM docker.elastic.co/kibana/kibana:${ELK_VERSION}

# add custom configuration
ADD --chown=kibana:root kibana-single-node.yml /usr/share/kibana/config/kibana.yml
Now, create a new YAML file and name it kibana-single-node.yml. The file should be created inside /elasticsearch-single-node-cluster/kibana directory, and include the following:
# A human-readable display name that identifies this Kibana instance. Default: "your-hostname"
server.name: "kibana-single-node"

# This setting specifies the host of the back end server. To allow remote users to connect, set
# the value to the IP address or DNS name of the Kibana server. Default: "localhost"
server.host: "0.0.0.0"

# Sets the grace period for Kibana to attempt to resolve any ongoing HTTP requests after receiving
# a SIGTERM/SIGINT signal, and before shutting down. Any new HTTP requests received during this
# period are rejected with a 503 response. Default: 30s
server.shutdownTimeout: "5s"

# Kibana is served by a back end server. This setting specifies the port to use. Default: 5601
server.port: 5601

# The URLs of the Elasticsearch instances to use for all your queries. All nodes listed here must
# be on the same cluster. Default: [ "http://localhost:9200" ]
elasticsearch.hosts: [ "http://elasticsearch-demo:9200" ]

# For Elasticsearch clusters that are running in containers, this setting changes the Node Listing
# to display the CPU utilization based on the reported Cgroup statistics. It also adds the calculated
# Cgroup CPU utilization to the Node Overview page instead of the overall operating system’s CPU
# utilization. Defaults to false.
monitoring.ui.container.elasticsearch.enabled: true

# For Logstash nodes that are running in containers, this setting changes the Logstash Node Listing
# to display the CPU utilization based on the reported Cgroup statistics. It also adds the calculated
# Cgroup CPU utilization to the Logstash node detail pages instead of the overall operating system’s
# CPU utilization. Defaults to false.
monitoring.ui.container.logstash.enabled: true

# Blocks Kibana access to any browser that does not enforce even rudimentary CSP rules. In practice,
# this disables support for older, less safe browsers like Internet Explorer. For more information,
# refer to Content Security Policy. Default: true
csp.strict: true

logging.verbose: true
We tried to include a brief description of each configuration parameter.
Add the following code to the already created docker-compose.yml :
  kibana-demo:
    hostname: kibana-demo
    container_name: kibana-demo
    build:
      context: ./kibana
      dockerfile: Dockerfile-single-node
      args:
        - ELK_VERSION=${ELK_VERSION}
    ports:
      - 5601:5601
    networks:
      - elastic-stack-service-network
4. Deploying the Cluster
Deploying the cluster is very easy. Just run the following command in a terminal window. Make sure you are in the same directory as the docker-compose-es-single-node.yml file.
$ docker-compose -f docker-compose-es-single-node.yml up -d
This will trigger the image download from the official Elastic repository. Once finished, it will start both containers. Wait a while for both containers to start, and execute the following commands to make sure that both Elasticsearch and Kibana are up and running.
First, let’s execute this curl command agains Elasticsearch:
$ curl http://localhost:9200/
{
  "name" : "elasticsearch-demo-single-node",
  "cluster_name" : "elastic-stack-single-node-cluster",
  "cluster_uuid" : "zH0lHxw-TjSbJdZgt_rtSA",
  "version" : {
    "number" : "7.16.2",
    "build_flavor" : "default",
    "build_type" : "docker",
    "build_hash" : "2b937c44140b6559905130a8650c64dbd0879cfb",
    "build_date" : "2021-12-18T19:42:46.604893745Z",
    "build_snapshot" : false,
    "lucene_version" : "8.10.1",
    "minimum_wire_compatibility_version" : "6.8.0",
    "minimum_index_compatibility_version" : "6.0.0-beta1"
  },
  "tagline" : "You Know, for Search"
}
If you see a response similar to the one we got, it means that Elasticsearch is up and running. now lets check Kibana. Using your favorite browser, navigate to http://localhost:5601.
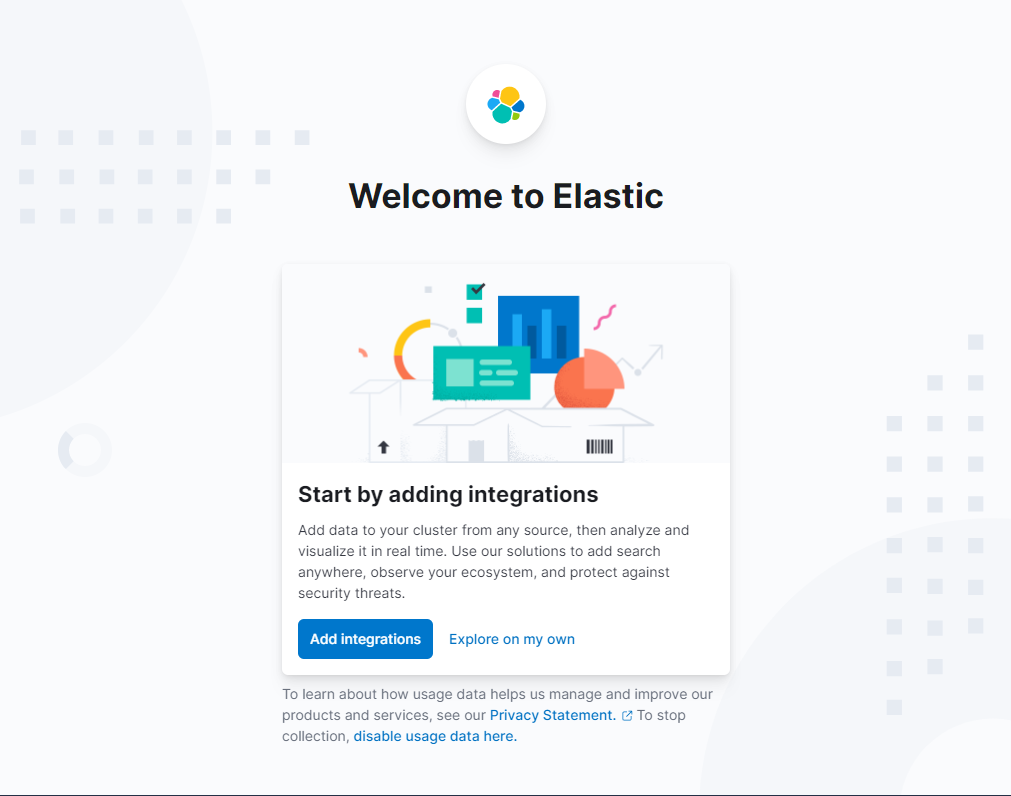
From here, we could either add integrations, or explore on our own. For now, lets explore on own.
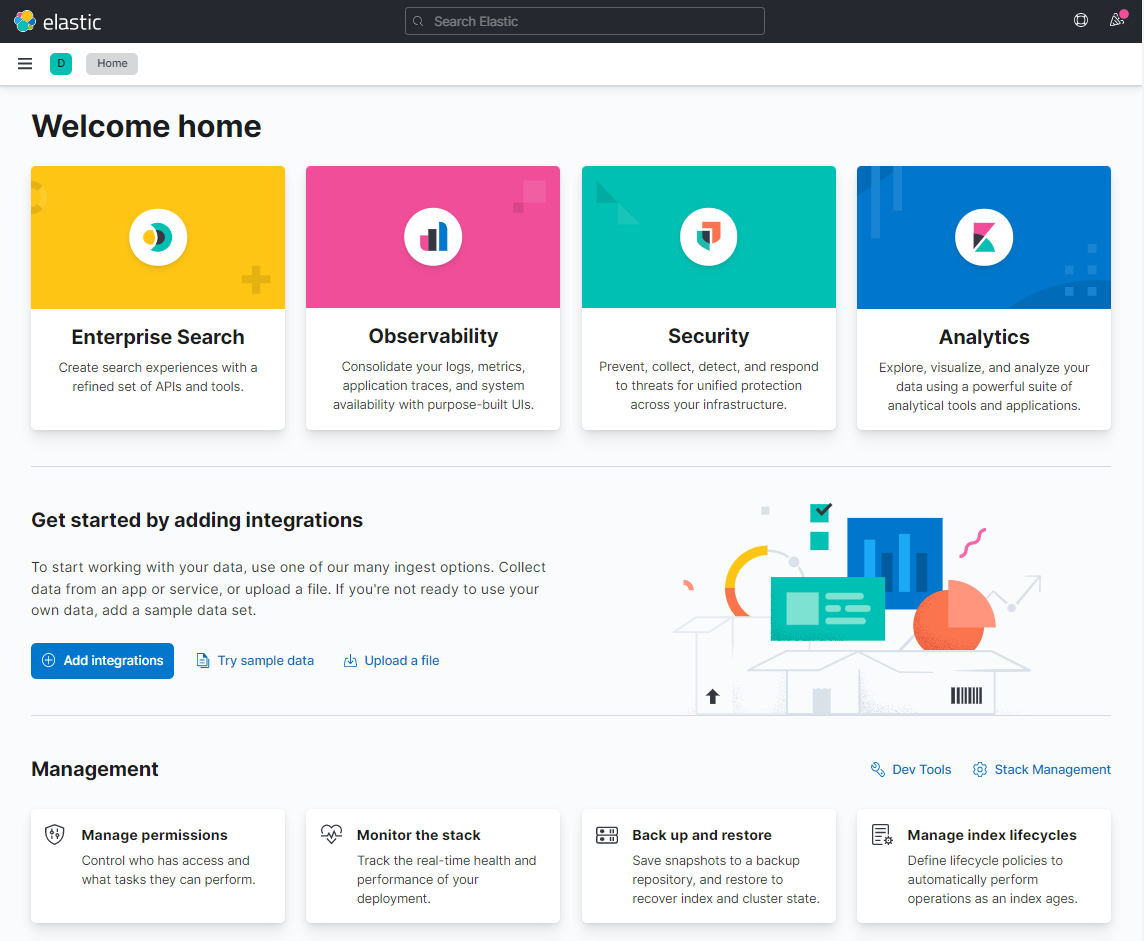
In the middle section, you can find “Try sample data” link. Click it, as we will add the samples, so that we can go through it.
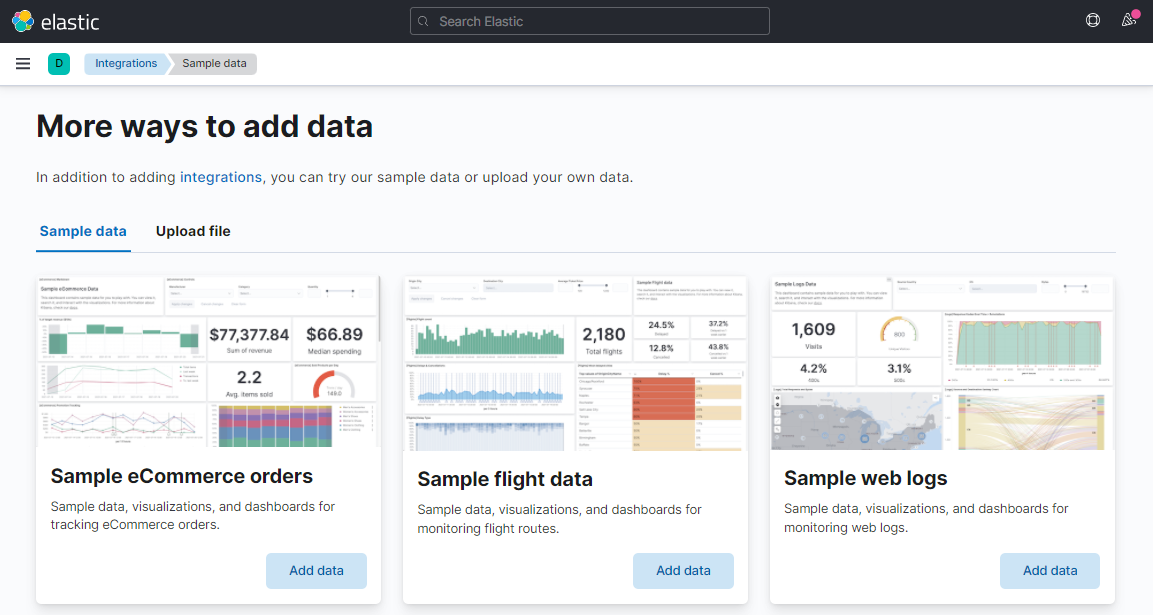
By clicking the <Add data> button, Kibana created several interesting things.
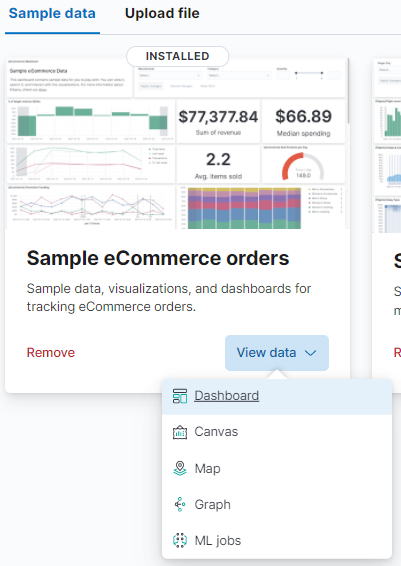
- Dashboard: It is a great way to displays a collection of visualizations and searches that help you understand your data.
- Canvas: Data visualization and presentation tool that allows you to pull live data from Elasticsearch.
- Map: Build a map to compare data by country or region.
- Graph: Enable you to discover how items in an Elasticsearch index are related.
- ML Jobs: analyze your data and generate models for its patterns of behavior.
Summary
In this post, we have deployed Elasticsearch and Kibana in a dockerized environment. Specifically, we have deployed Elasticsearch as a search and analitics engine, and Kibana for visualizing the data. We hope that, even though this was a very basic introduction, you understood how to use and configure them. We will try to go deeper into Elastic Stack in upcoming posts.
Please feel free to contact us. We will gladly response to any doubt or question you might have. In the mean time, you can download the source code from our official GitHub repository.
[…] In our following posts, we will dive deeper into each of the components. But first, you will learn how to deploy Elastic Stack cluster (single-node) using Docker. […]