Getting Started with Logstash
In this post, we give a brief introduction to Logstash, and afterwards, we deploy it in a dockerized environment.
Introduction
So far, we have learn about Elasticsearch for storing the data that we collect and how to deploy it, Kibana as a Web UI for visualizing the collected data, and Filebeat for collecting data from our cluster. Now, it is time to learn about Logstash and how it can enrich the collected data.
Logstash is an open source engine designed for collecting data in real-time using pipelines. Thanks to Logstash, we can dynamically unify data from disparate sources and normalize the data into destinations of our choice.
How does Logstash work?
The Logstash event processing pipeline has three stages: inputs → filters → outputs. Inputs generate events, filters modify them, and outputs send the data to a specific destination. Inputs and outputs support codecs that enable you to encode or decode the data as it enters or exits the pipeline without having to use a separate filter.
In this post, we will learn about Logstash, configure and deploy one as a docker service. This Logstash will:
- Have multiple inputs:
- One input of type heartbeat, which generates heartbeat messages. The general intention of this is to test the performance and availability of Logstash.
- One exec input, which periodically run a shell command and capture the whole output as an event.
- And from a Filebeat that will be deployed as a Daemonset.
- Use filters to enrich the input message generated from the exec input.
- Use data-stream for storing append-only time series data across multiple indices while giving you a single named resource for requests. Data streams are well-suited for logs, events, metrics, and other continuously generated data.
- Use Logstash pipeline-to-pipeline communications for connecting multiple pipelines within the same Logstash instance.
In other posts, we will go deeper into data-streams and pipeline-to-pipeline communications. For now, lets see how to deploy Logstash in a dockerized environment.
Deploying Logstash in Docker
Let’s start by adding a folder which will have Logstash’s files. The changes in the project should be highlighted.
elastic-stack-demo
  +- elasticsearch-single-node-cluster
       +- elasticsearch
       |    +- Dockerfile-elasticsearch-single-node
       |    +- elasticsearch-single-node.yml
       +-filebeat
       |    +- Dockerfile
       |    +- filebeat-to-elasticsearch.yml
       |    +- filebeat-to-logstash.yml
       +-kibana
       |    +- Dockerfile-kibana-single-node
       |    +- kibana-single-node.yml
       +-logstash
       |    +- config
       |    |    +- logstash.yml
       |    |    +- pipelines.yml
       |    +- pipeline
       |    |    +- beats-example.conf
       |    |    +- data-stream-example.conf
       |    |    +- output.conf
       |    +- Dockerfile
       +- .env
       +- docker-compose-es-single-node.yml
       +- docker-compose-filebeat-to-elasticseach.yml
       +- docker-compose-logstash.yml
The first file we will be creating is the Dockerfile. Create it under elastic-stack-single-node-cluster/logstash/, and paste the following code:
ARG ELK_VERSION

FROM docker.elastic.co/logstash/logstash:${ELK_VERSION}

RUN rm -f /usr/share/logstash/pipeline/logstash.conf

# pipeline source folder
ADD --chown=logstash:logstash pipeline/ /usr/share/logstash/pipeline/

# pipeline configurations
ADD --chown=root:logstash config/pipelines.yml /usr/share/logstash/config/pipelines.yml

# add logstash configuration
ADD --chown=root:logstash config/logstash.yml /usr/share/logstash/config/logstash.yml

# add any plug in
# RUN bin/logstash-plugin install logstash-filter-math
This is what we are doing in this Dockerfile file:
- Line 5: Removing default Logstash configuration file.
- Line 8: Adding our customized pipelines configurations.
- Line 11: Since we are running more than one pipeline in the same process, we need to add the configuration for each pipeline.
- Line 14: Adding our customized Logstash configuration file.
- Line 17: An example on how to add additional plugins.
Next, create a logstash.yml file under elastic-stack-single-node-cluster/logstash/config, and paste the following:
http.host: "0.0.0.0"
xpack.monitoring.enabled: true
xpack.monitoring.elasticsearch.hosts: [ "http://elasticsearch-demo:9200" ]
log.level: info
In the same folder, we will create a file called pipelines.yml, and paste this:
# This file is where you define your pipelines. You can define multiple.
# For more information on multiple pipelines, see the documentation:
#   https://www.elastic.co/guide/en/logstash/current/multiple-pipelines.html

 - pipeline.id: data-stream-example
   path.config: "./pipeline/data-stream-example.conf"
 - pipeline.id: beats-example
   path.config: "./pipeline/beats-example.conf"
 - pipeline.id: output
   path.config: "./pipeline/output.conf"
This file contains the configuration for the three pipelines we will be using. As you can see, we just specified the basic information. An id for each pipeline, and a route to where the configuration of that pipeline is.
data-stream-example pipeline will generate events from a heartbeat input and from an exec input. Whereas, beats-example pipeline will receive the information from a Filebeat that we will configure later on. Both pipelines will send the events to output pipeline, which is in charge of sending the already processed events to Elasticsearch.
As we have said, each pipeline has a configuation file. Here is data-stream-example configuration file. The name of the file is data-stream-example.yml file, found under elastic-stack-single-node-cluster/logstash/pipeline:
input {
    heartbeat {
        interval => 5
        message  => 'Hello World from heartbeat-data-stream 💓'
        tags => [ 'heartbeat-data-stream' ]
        add_field => { '[data_stream][namespace]' => 'local' }
        add_field => { '[data_stream][type]' => 'logs' }
        add_field => { '[data_stream][dataset]' => 'heartbeat.data.stream' }
    }

    exec {
        command => "uptime"
        interval => 10
        tags => [ 'uptime-data-stream' ]
        add_field => { '[data_stream][namespace]' => 'local' }
        add_field => { '[data_stream][type]' => 'logs' }
        add_field => { '[data_stream][dataset]' => 'uptime.data.stream' }
    }
}

filter {
    mutate { remove_field => [ 'host' ] }

    if 'uptime-data-stream' in [tags] {
        grok {
            match => { 'message' => '%{TIME:currentTime} %{WORD:status}  %{HOUR:hoursUp}:%{MINUTE:minutesUp},  %{NUMBER:users} users,  load average: %{NUMBER:loadAverageCpuPerMinute}, %{NUMBER:loadAverageCpuPerFiveMinutes}, %{NUMBER:loadAverageCpuPerFifteenMinutes}' }
        }
        mutate {
            remove_field => [ 'message' ]
        }
    }
}

output {
    pipeline { send_to => [commonOut] }
}
As you can see, it has two inputs:
- One input of type heartbeat, which generates heartbeat messages. The general intention of this is to test the performance and availability of Logstash.
- One exec input, which periodically run a shell command and capture the whole output as an event.
Notice that in each input, we are adding three fields. These fields will be used later in the output pipeline, to determine where the capture event should be sent.
In the filter section, if the event was generated by the exec input, we parse and split the message field, into independent fields.
Here is beats-example configuration file. The name of the file is beats-example.yml file, found under elastic-stack-single-node-cluster/logstash/pipeline:
input {
    beats {
        tags => [ 'filebeat' ]
        port => 5044
        add_field => { '[data_stream][namespace]' => 'local' }
        add_field => { '[data_stream][type]' => 'logs' }
        add_field => { '[data_stream][dataset]' => 'filebeat' }
    }
}

output {
    pipeline { send_to => [commonOut] }
}
And finally, Here is beats-example configuration file. The name of the file is output.yml file, found under elastic-stack-single-node-cluster/logstash/pipeline:
input {
  pipeline {
    address => commonOut
  }
}

output {
#    stdout { codec =>  'rubydebug' }

    elasticsearch {
        hosts => [ 'http://elasticsearch-demo:9200' ]
        data_stream => 'true'
        data_stream_auto_routing => 'true'
    }
}
We have configured Logstash. The next thing would be to create a docker-compose file under elastic-stack-single-node-cluster/ and name it docker-compose-logstash.yml.
version: '3.9'
services:
  logstash-demo:
    build:
      context: logstash/
      args:
        - ELK_VERSION=${ELK_VERSION}
    ports:
      - 9600:9600
    hostname: logstash-demo
    container_name: logstash-demo
    logging:
      driver: "json-file"
      options:
        max-size: "10k"
        max-file: "10"
    environment:
      - "LS_JAVA_OPTS=-Xms512m -Xmx512m"
    labels:
      co.elastic.logs/module: logstash
      co.elastic.metrics/module: logstash
    networks:
      - elastic-stack-service-network

# Networks to be created to facilitate communication between containers
networks:
  elastic-stack-service-network:
    name: elastic-stack-service-network
Great. We are ready to start Logstash, by executing the following command:
$ docker-compose -f docker-compose-logstash.yml up -d --build
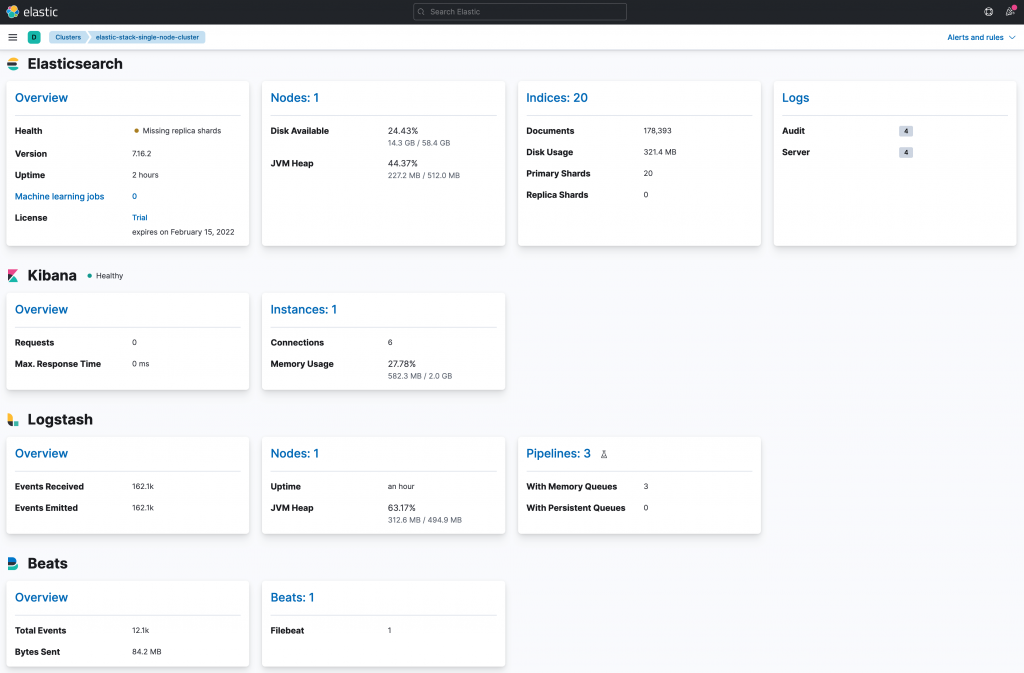
Once up, wait a few minutes and go to Management > Stack Monitoring. You should be able to see Logstash as part of your cluster monitoring.
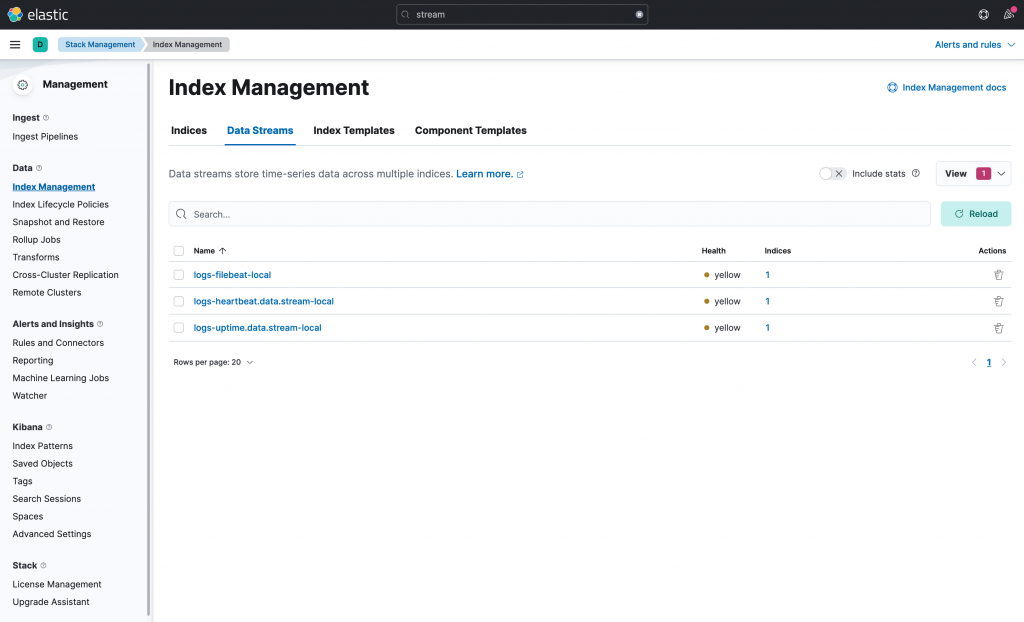
And if you go to Management > Stack Monitoring > Index Management, and click in the Data Streams, you should see the three data streams created by out Logstash pipelines.
However, even though the data streams are already created, the data stream from beats-example pipeline is not receiving anything. This is because there is no beat sending events to Logstash. In the following section, we will start a Filebeat and read our cluster logs. This is the same Filebeat that we have already deployed in this post. The only difference, is that we will be sending the events to Logstash.
Deploying Filebeat in Docker
In one of our previous posts, we deployed a Filebeat that captures all the logs generated by all our containers and by our cluster. But this Filebeat sent those captured events directly to Elasticsearch. Now, we will be deploying the same Filebeat, but the events will be sent to Logstash.
Let’s begin by creating a docker-compose file under elastic-stack-single-node-cluster/ and name it docker-compose-filebeat-to-logstash.yml.
Next, we need the configuration YAML file named filebeat-to-logstash.yml. Created it under elastic-stack-single-node-cluster/filebeat/. Here is the code you will need:
######################## Filebeat Configuration ############################
# You can find the full configuration reference here:
# https://www.elastic.co/guide/en/beats/filebeat/index.html

# ========================== Filebeat global options ===========================
# Enable filebeat config reloading
filebeat.config:
  modules:
    path: ${path.config}/modules.d/*.yml
    reload.enabled: false

# =========================== Filebeat autodiscover ============================
# Autodiscover allows you to detect changes in the system and spawn new modules
# or inputs as they happen.
filebeat.autodiscover:
  # List of enabled autodiscover providers
  providers:
    - type: docker
      hints.enabled: true

# ================================= Processors =================================
# Processors are used to reduce the number of fields in the exported event or to
# enhance the event with external metadata. This section defines a list of
# processors that are applied one by one and the first one receives the initial
# event:
#
#   event -> filter1 -> event1 -> filter2 ->event2 ...
#
# The supported processors are drop_fields, drop_event, include_fields,
# decode_json_fields, and add_cloud_metadata.
processors:
  # The following example enriches each event with docker metadata, it matches
  # container id from log path available in `source` field (by default it expects
  # it to be /var/lib/docker/containers/*/*.log).
  - add_docker_metadata: ~
  # The following example enriches each event with host metadata.
  - add_host_metadata: ~

# ================================== Outputs ===================================
# Configure what output to use when sending the data collected by the beat.
# ------------------------------ Logstash Output -------------------------------
output.logstash:
  # Boolean flag to enable or disable the output module.
  enabled: true

  # The Logstash hosts
  hosts: ["logstash-demo:5044"]

  # Optionally load-balance events between Logstash hosts. Default is false.
  #loadbalance: false

# ================================= Dashboards =================================
# These settings control loading the sample dashboards to the Kibana index. Loading
# the dashboards are disabled by default and can be enabled either by setting the
# options here, or by using the `-setup` CLI flag or the `setup` command.
setup.dashboards.enabled: true

# =================================== Kibana ===================================
# Starting with Beats version 6.0.0, the dashboards are loaded via the Kibana API.
# This requires a Kibana endpoint configuration.
setup.kibana:
  # Kibana Host
  # Scheme and port can be left out and will be set to the default (http and 5601)
  # In case you specify and additional path, the scheme is required: http://localhost:5601/path
  # IPv6 addresses should always be defined as: https://[2001:db8::1]:5601
  host: "kibana-demo:5601"

# ================================== Logging ===================================
# There are four options for the log output: file, stderr, syslog, eventlog
# The file output is the default.
# Sets log level. The default log level is info.
# Available log levels are: error, warning, info, debug
logging.level: info

# Write Filebeat own logs only to file to avoid catching them with itself in docker log files
# When true, writes all logging output to files. The log files are automatically rotated when the
# log file size limit is reached.
logging.to_files: true

# When true, writes all logging output to the syslog. This option is not supported on Windows.
logging.to_syslog: false

# ============================= X-Pack Monitoring ==============================
# Filebeat can export internal metrics to a central Elasticsearch monitoring
# cluster.  This requires xpack monitoring to be enabled in Elasticsearch.  The
# reporting is disabled by default.

# Set to true to enable the monitoring reporter.
monitoring.enabled: true

# Uncomment to send the metrics to Elasticsearch. Most settings from the
# Elasticsearch output are accepted here as well.
# Note that the settings should point to your Elasticsearch *monitoring* cluster.
# Any setting that is not set is automatically inherited from the Elasticsearch
# output configuration, so if you have the Elasticsearch output configured such
# that it is pointing to your Elasticsearch monitoring cluster, you can simply
# uncomment the following line.
monitoring.elasticsearch:
  # Array of hosts to connect to.
  # Scheme and port can be left out and will be set to the default (http and 9200)
  # In case you specify and additional path, the scheme is required: http://localhost:9200/path
  # IPv6 addresses should always be defined as: https://[2001:db8::1]:9200
  hosts: ['elasticsearch-demo:9200']

# =============================== HTTP Endpoint ================================
# Each beat can expose internal metrics through a HTTP endpoint. For security
# reasons the endpoint is disabled by default. This feature is currently experimental.
# Stats can be access through http://localhost:5066/stats . For pretty JSON output
# append ?pretty to the URL.
# Defines if the HTTP endpoint is enabled.
http.enabled: true

# The HTTP endpoint will bind to this hostname, IP address, unix socket or named pipe.
# When using IP addresses, it is recommended to only use localhost.
http.host: filebeat-to-logstash-demo

# Port on which the HTTP endpoint will bind. Default is 5066.
http.port: 5066
Lines 39 to 50 specify the output configuration. See that we have specified the port to which the events should be sent, and that it is the same port as the one configure in the input section of the beats-example pipeline.
Great. We are ready to start Filebeat, by executing the following command:
$ docker-compose -f docker-compose-filebeat-to-logstash.yml up -d --build
That’s it. Logstash should be already receiving events from Filebeat. Let’s make sure of this, by creating first an index patter in Kibana.
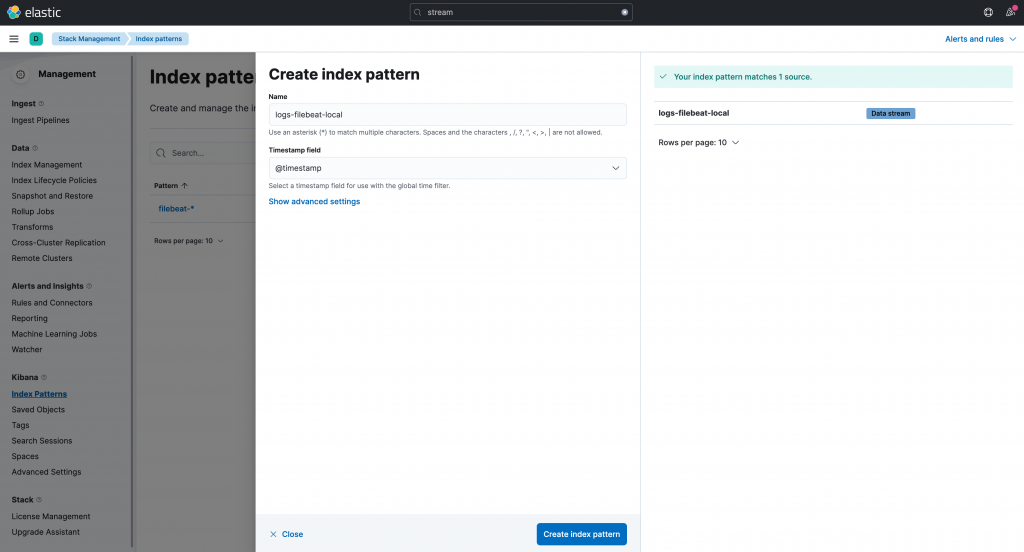
Go to Management > Stack Monitoring > Kibana > Index Patterns, and click on the Create Index Pattern button located in the top right corner. Fill in the information as shown in the below image and click on the Create Index Pattern button located in the bottom middle. Repeat the step for the other data sreams.
If you would like to see the indexed logs, go to Analytics > Discover.
Clean Up
To do a complete clean up, execute this command:
$ docker-compose -f docker-compose-es-single-node.yml -f docker-compose-filebeat-to-elasticseach.yml -f docker-compose-filebeat-to-logstash.yml -f docker-compose-logstash.yml down -v
Summary
In this post, we learn about Logstash and how to configure and deploy it in a dockerized environment. We also saw how to configure Logstash to use pipeline-to-pipeline communications and data-streams (although we will go deeper into them in other posts).
In addition, we have deployed Filebeat in a dockerized environment, using hints with autodiscover to monitor Elasticsearch and Kibana, but configure it so send the capture events to Logstash.
Please feel free to contact us. We will gladly response to any doubt or question you might have. In the mean time, you can download the source code from our official GitHub repository.