Introduction to Elastic Stack
Hello friends! In this post, we will give you a small introduction to Elastic Stack including all the products that build it.
Introduction
First things first. What is Elastic Stack? Well, Elastic Stack is a set of open-source products, originally designed to help users gather data from different sources and in any format, and allow them to perform some actions on these data, such as real-time searches, analysis or visualization. You might know these group of products as ELK, which stands for Elasticsearch, Kibana and Logstash. Later on, Beats product was added to the stack.
Nowadays, Elastic Stack is also know for being a complete end-to-end log analysis solution. Thanks to it’s Observability feature, users can perform centralized logging helping them in identifying the problems with the web servers or applications fast and easy.
Elastic Stack Components
For now, we will just give a brief description of all the products that form the Elastic Stack.
- At the heart of Elastic Stack, we find Elasticsearch. Consider it a distributed search and analytics engine, which provides near real-time search and analytics for all types of data. It does not matter the nature of your data, if it is structured or unstructured text, numerical data, or geospatial data, Elasticsearch can efficiently store and index it in a way that supports fast searches.
- Logstash is a data collection engine with real-time pipelining capabilities. It allow the unification and normalization of data coming from different sources before sending it into destinations of your choice.
- Beats are data shippers that you install as agents on your servers to send operational data to Elasticsearch.
- Kibana is data visualization and exploration tool from that is specialized for large volumes of streaming and real-time data. The software makes huge and complex data streams more easily and quickly understandable through graphic representation.
In our following posts, we will dive deeper into each of the components. But first, allow us to show you the architecture of what we will be building with the help of the following posts.
Elastic Stack Architecture in Docker
Because we will be deploying a single node cluster, we decided that using Docker Compose is the easiest way of formulating a full stack example. The below image, is a visual representation of the architecture used in our example.
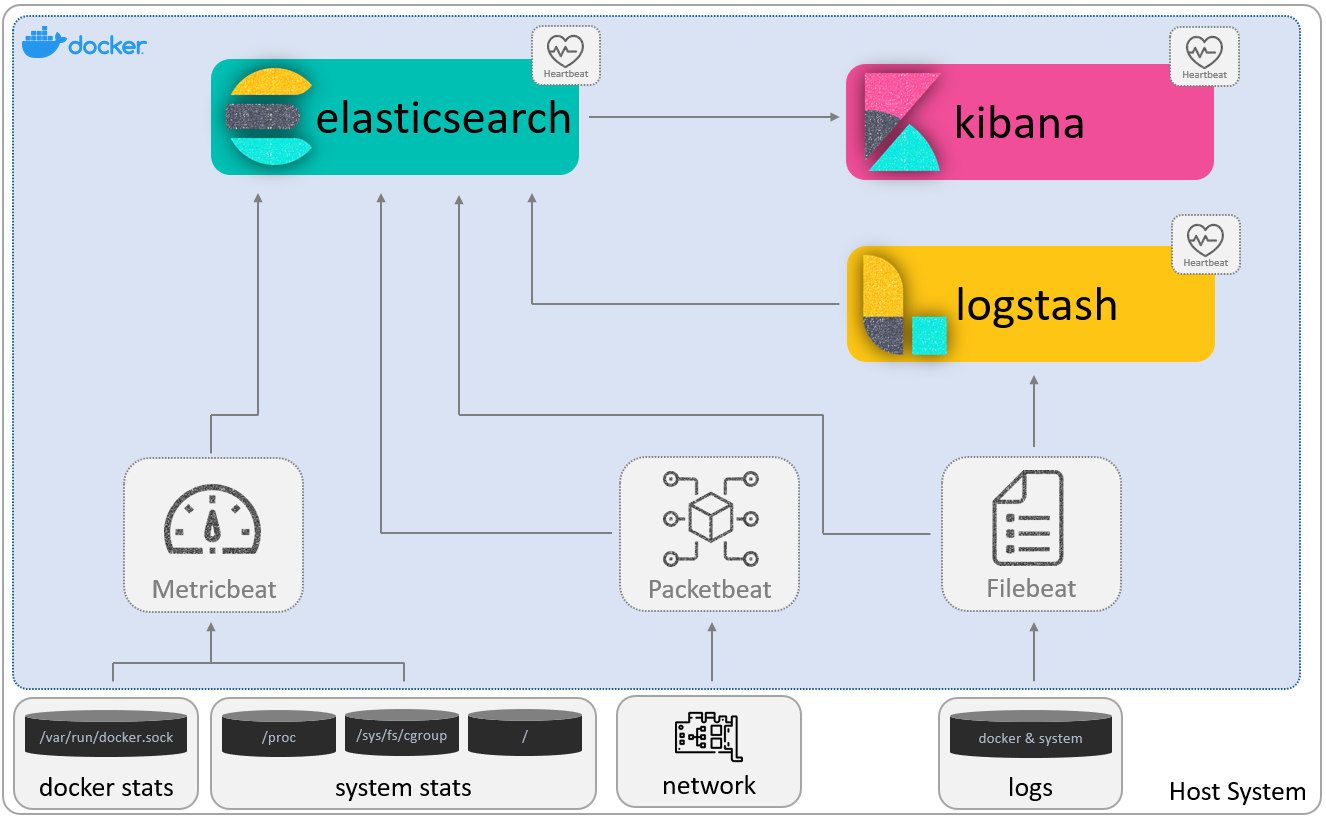
In different steps, we will deploy each component. The first thing will be to deploy Elasticsearch and Kibana. That way, we have a cluster ready for indexing and storaging data, including a visual tool.
Next, to test this cluster, we will deploy Filebeat. This first filebeat will read docker and system logs, and send them directly to Elasticsearch.
As a third step, we will deploy Logstash. We will not complecate things, so we will send docker and system logs to it, with the help of a second Filebeat. The purpose is to see how they communicate with each other, and how Logstash can parse and enricht the logs.
As a fourth container, we will launch Metricbeat. With it, we will be monitoring both docker and system stats before sending them to Elasticsearch.
To see the network traffic in our interfaces, we will deploy Packetbeat in a fifth step.
Continuing, to audit the activities of users and processes on our systems, detect changes to critical files, and identify potential security policy violations, we will deploy Auditbeat.
And finally, we will deploy Heartbeat in a sixth and last container. We have represented this Beat as if it was attached to Elasticsearch, Kibana and Logstash containers. But in reality, it is an independent container monitoring other containers via http, tcp and icmp.
We really hope you will enjoy deploying this architecture as much as we did. So, without more, let’s move on and will learn how to deploy Elastic Stack cluster (single-node) using Docker.
[…] far, we have learn about Elasticsearch for storing the data that we collect and how to deploy it, Kibana as a Web…, and Filebeat for collecting data from our cluster. Now, it is time to learn about Logstash and how […]