Audit the activities of users and processes on your systems with Auditbeat
Get to know Auditbeat and learn how it can help you by auditing the activities of the users and processes on your systems. All within a dockerized enviroment.
Introduction
Hi my friend! So far, we are almost done configuring our architecture. As a reminder, we have learnt about Elasticsearch for storing the data that we collect and how to deploy it, Kibana as a Web UI for visualizing the collected data, Filebeat for collecting data from our cluster, we saw what Logstash can do, collected metrics from the system and services running on the server with the help of Metricbeat, discover if your service is up thanks to Heartbeat, and analyzed your network traffic with Packetbeat. Now, let’s see how to audit the activities of the users and processes on your systems.
Overview
Auditbeat is a lightweight shipper that you can install on your servers to audit the activities of users and processes on your systems, detect changes to critical files, and identify potential security policy violations.
Just as any other Elastic Beat, Auditbeat is based on the libbeat framework.
Deploying Auditbeat in Docker
Let’s begin by adding a folder which will have Pcketbeat’s files. The changes in the project should be highlighted.
elastic-stack-demo
  +- elasticsearch-single-node-cluster
       +- auditbeat
       |    +- Dockerfile
       |    +- auditbeat.yml
       +- elasticsearch
       |    +- Dockerfile-elasticsearch-single-node
       |    +- elasticsearch-single-node.yml
       +-filebeat
       |    +- Dockerfile
       |    +- filebeat-to-elasticsearch.yml
       |    +- filebeat-to-logstash.yml
       +-heartbeat
       |    +- Dockerfile
       |    +- heartbeat.yml
       |    +- http_dashboard.ndjson
       +-kibana
       |    +- Dockerfile-kibana-single-node
       |    +- kibana-single-node.yml
       +-logstash
       |    +- config
       |    |    +- logstash.yml
       |    |    +- pipelines.yml
       |    +- pipeline
       |    |    +- beats-example.conf
       |    |    +- data-stream-example.conf
       |    |    +- output.conf
       |    +- Dockerfile
       +-metricbeat
       |    +- Dockerfile
       |    +- metricbeat.yml
       +-packetbeat
       |    +- Dockerfile
       |    +- packetbeat.yml
       +- .env
       +- docker-compose-auditbeat.yml
       +- docker-compose-es-single-node.yml
       +- docker-compose-filebeat-to-elasticseach.yml
       +- docker-compose-filebeat-to-logstash.yml
       +- docker-compose-heartbeat.yml
       +- docker-compose-logstash.yml
       +- docker-compose-metricbeat.yml
       +- docker-compose-packetbeat.yml
As we have been doing so far, the first file we will be creating is the Dockerfile. Create it under elastic-stack-single-node-cluster/auditbeat/, and paste the following code:
ARG ELK_VERSION
FROM docker.elastic.co/beats/auditbeat:${ELK_VERSION}

# add custom configuration
COPY --chown=root:auditbeat auditbeat.yml /usr/share/auditbeat/auditbeat.yml
The file has nothing extraordinary. It is just specifying the base image and copying the configuration YAML file for Auditbeat. This configuration file looks like this:
########################## Auditbeat Configuration #############################
# You can find the full configuration reference here:
# https://www.elastic.co/guide/en/beats/auditbeat/index.html

# =========================== Modules configuration ============================
auditbeat.modules:
  # The auditd module collects events from the audit framework in the Linux
  # kernel. You need to specify audit rules for the events that you want to audit.
  - module: auditd
    ## Define audit rules here.
    audit_rules: |
      -w /etc/passwd -p wa -k identity
      -a always,exit -F arch=b32 -S open,creat,truncate,ftruncate,openat,open_by_handle_at -F exit=-EPERM -k access

  # The file integrity module sends events when files are changed (created,
  # updated, deleted). The events contain file metadata and hashes.
  - module: file_integrity
    paths:
      - /bin
      - /usr/bin
      - /sbin
      - /usr/sbin
      - /etc
    # List of regular expressions to filter out notifications for unwanted files.
    # Wrap in single quotes to workaround YAML escaping rules. By default no files
    # are ignored.
    exclude_files:
      - '(?i)\.sw[nop]$'
      - '~$'
      - '/\.git($|/)'

  - module: system
    datasets:
      - host # General host information, e.g. uptime, IPs
      - user # User information
    period: 1m
    user.detect_password_changes: true

  - module: system
    datasets:
      - process # Started and stopped processes
#      - socket  # Opened and closed sockets
    period: 1s

# ================================= Processors =================================
# Processors are used to reduce the number of fields in the exported event or to
# enhance the event with external metadata. This section defines a list of
# processors that are applied one by one and the first one receives the initial
# event:
#
#   event -> filter1 -> event1 -> filter2 ->event2 ...
#
# The supported processors are drop_fields, drop_event, include_fields,
# decode_json_fields, and add_cloud_metadata.
processors:
  # The following example enriches each event with docker metadata, it matches
  # container id from log path available in `source` field (by default it expects
  # it to be /var/lib/docker/containers/*/*.log).
  - add_docker_metadata: ~
  # The following example enriches each event with host metadata.
  - add_host_metadata: ~

# ================================== Outputs ===================================
# Configure what output to use when sending the data collected by the beat.
# ---------------------------- Elasticsearch Output ----------------------------
output.elasticsearch:
  # Boolean flag to enable or disable the output module.
  enabled: true
  # Array of hosts to connect to.
  # Scheme and port can be left out and will be set to the default (http and 9200)
  # In case you specify and additional path, the scheme is required: http://localhost:9200/path
  # IPv6 addresses should always be defined as: https://[2001:db8::1]:9200
  hosts: ['elasticsearch-demo:9200']

# ================================= Dashboards =================================
# These settings control loading the sample dashboards to the Kibana index. Loading
# the dashboards are disabled by default and can be enabled either by setting the
# options here, or by using the `-setup` CLI flag or the `setup` command.
setup.dashboards.enabled: true

# =================================== Kibana ===================================
# Starting with Beats version 6.0.0, the dashboards are loaded via the Kibana API.
# This requires a Kibana endpoint configuration.
setup.kibana:
  # Kibana Host
  # Scheme and port can be left out and will be set to the default (http and 5601)
  # In case you specify and additional path, the scheme is required: http://localhost:5601/path
  # IPv6 addresses should always be defined as: https://[2001:db8::1]:5601
  host: "kibana-demo:5601"

# ================================== Logging ===================================
# There are four options for the log output: file, stderr, syslog, eventlog
# The file output is the default.
# Sets log level. The default log level is info.
# Available log levels are: error, warning, info, debug
logging.level: info

# Write auditbeat own logs only to file to avoid catching them with itself in docker log files
# When true, writes all logging output to files. The log files are automatically rotated when the
# log file size limit is reached.
logging.to_files: false

# When true, writes all logging output to the syslog. This option is not supported on Windows.
logging.to_syslog: false

# ============================= X-Pack Monitoring ==============================
# auditbeat can export internal metrics to a central Elasticsearch monitoring
# cluster.  This requires xpack monitoring to be enabled in Elasticsearch.  The
# reporting is disabled by default.

# Set to true to enable the monitoring reporter.
monitoring.enabled: true

# Uncomment to send the metrics to Elasticsearch. Most settings from the
# Elasticsearch output are accepted here as well.
# Note that the settings should point to your Elasticsearch *monitoring* cluster.
# Any setting that is not set is automatically inherited from the Elasticsearch
# output configuration, so if you have the Elasticsearch output configured such
# that it is pointing to your Elasticsearch monitoring cluster, you can simply
# uncomment the following line.
monitoring.elasticsearch:
  # Array of hosts to connect to.
  # Scheme and port can be left out and will be set to the default (http and 9200)
  # In case you specify and additional path, the scheme is required: http://localhost:9200/path
  # IPv6 addresses should always be defined as: https://[2001:db8::1]:9200
  #hosts: ["elasticsearch-demo:9200"]

# =============================== HTTP Endpoint ================================
# Each beat can expose internal metrics through a HTTP endpoint. For security
# reasons the endpoint is disabled by default. This feature is currently experimental.
# Stats can be access through http://localhost:5066/stats . For pretty JSON output
# append ?pretty to the URL.
# Defines if the HTTP endpoint is enabled.
http.enabled: true

# The HTTP endpoint will bind to this hostname, IP address, unix socket or named pipe.
# When using IP addresses, it is recommended to only use localhost.
http.host: auditbeat-demo

# Port on which the HTTP endpoint will bind. Default is 5066.
http.port: 5066
As you can see, we have included the description of each configuration option. Hopefully, it will be easier to understand it. However, the main idea behind it, is:
-
- Enable auditd module for collecting events from the audit framework in the Linux kernel.
- Enable file integrity module for sending events when files are changed
- Enable providers, which work by watching for events on the system and translating those events into internal autodiscover events with a common format.
- Send the collected data to Elasticsearch for indexing.
- Export internal metrics to a central Elasticsearch monitoring cluster, by enabling x-pack monitoring. In our case, we will be using the same cluster.
- Enable experimental HTTP endpoint, which exposes internal metrics.
Now, we create a separate docker-compose file under elastic-stack-single-node-cluster/ and name it docker-compose-auditbeat.yml.
version: '3.9'
services:
  auditbeat-demo:
    hostname: auditbeat-demo
    container_name: auditbeat-demo
    build:
      context: ./auditbeat
      dockerfile: Dockerfile
      args:
        - ELK_VERSION=${ELK_VERSION}
    ports:
      - 5566:5066
    # Need to override user so we can access the log files, and docker.sock
    user: root
    # https://www.elastic.co/guide/en/beats/auditbeat/current/running-on-docker.html#_special_requirements
    # PID and CAP_ADD options are ignored as they are Not yet available in swarm mode at the moment.
    # Eagerly waiting for Docker 19.06 release which will bring --privileged flag to Docker
    # Swarm Mode https://github.com/moby/moby/issues/24862#issuecomment-451594187
    # support for capabilities https://github.com/moby/moby/pull/38380
    pid: host
    cap_add:
      - AUDIT_CONTROL
      - AUDIT_READ
    volumes:
      - data_auditbeat_demo:/usr/share/auditbeat/data
    # disable strict permission checks
    command: [ '-e', '-v', '--strict.perms=false' ]
    deploy:
      mode: global
    networks:
      - elastic-stack-service-network

# Networks to be created to facilitate communication between containers
networks:
  elastic-stack-service-network:
    name: elastic-stack-service-network

# Volumes
volumes:
  data_auditbeat_demo:
    driver: local
When deploying auditbeat in a dockerized environement, there are some special requirements. Auditbeat runs as a non-root user, but requires some privileged capabilities to operate correctly. That is why, we have included option cap_add: AUDIT_CONTROL and AUDIT_READ. Furthermore, it is also essential to run Auditbeat in the host PID namespace.
Great. We are ready to start Auditbeat, by executing the following command:
$ docker-compose -f docker-compose-auditbeat.yml up -d --build
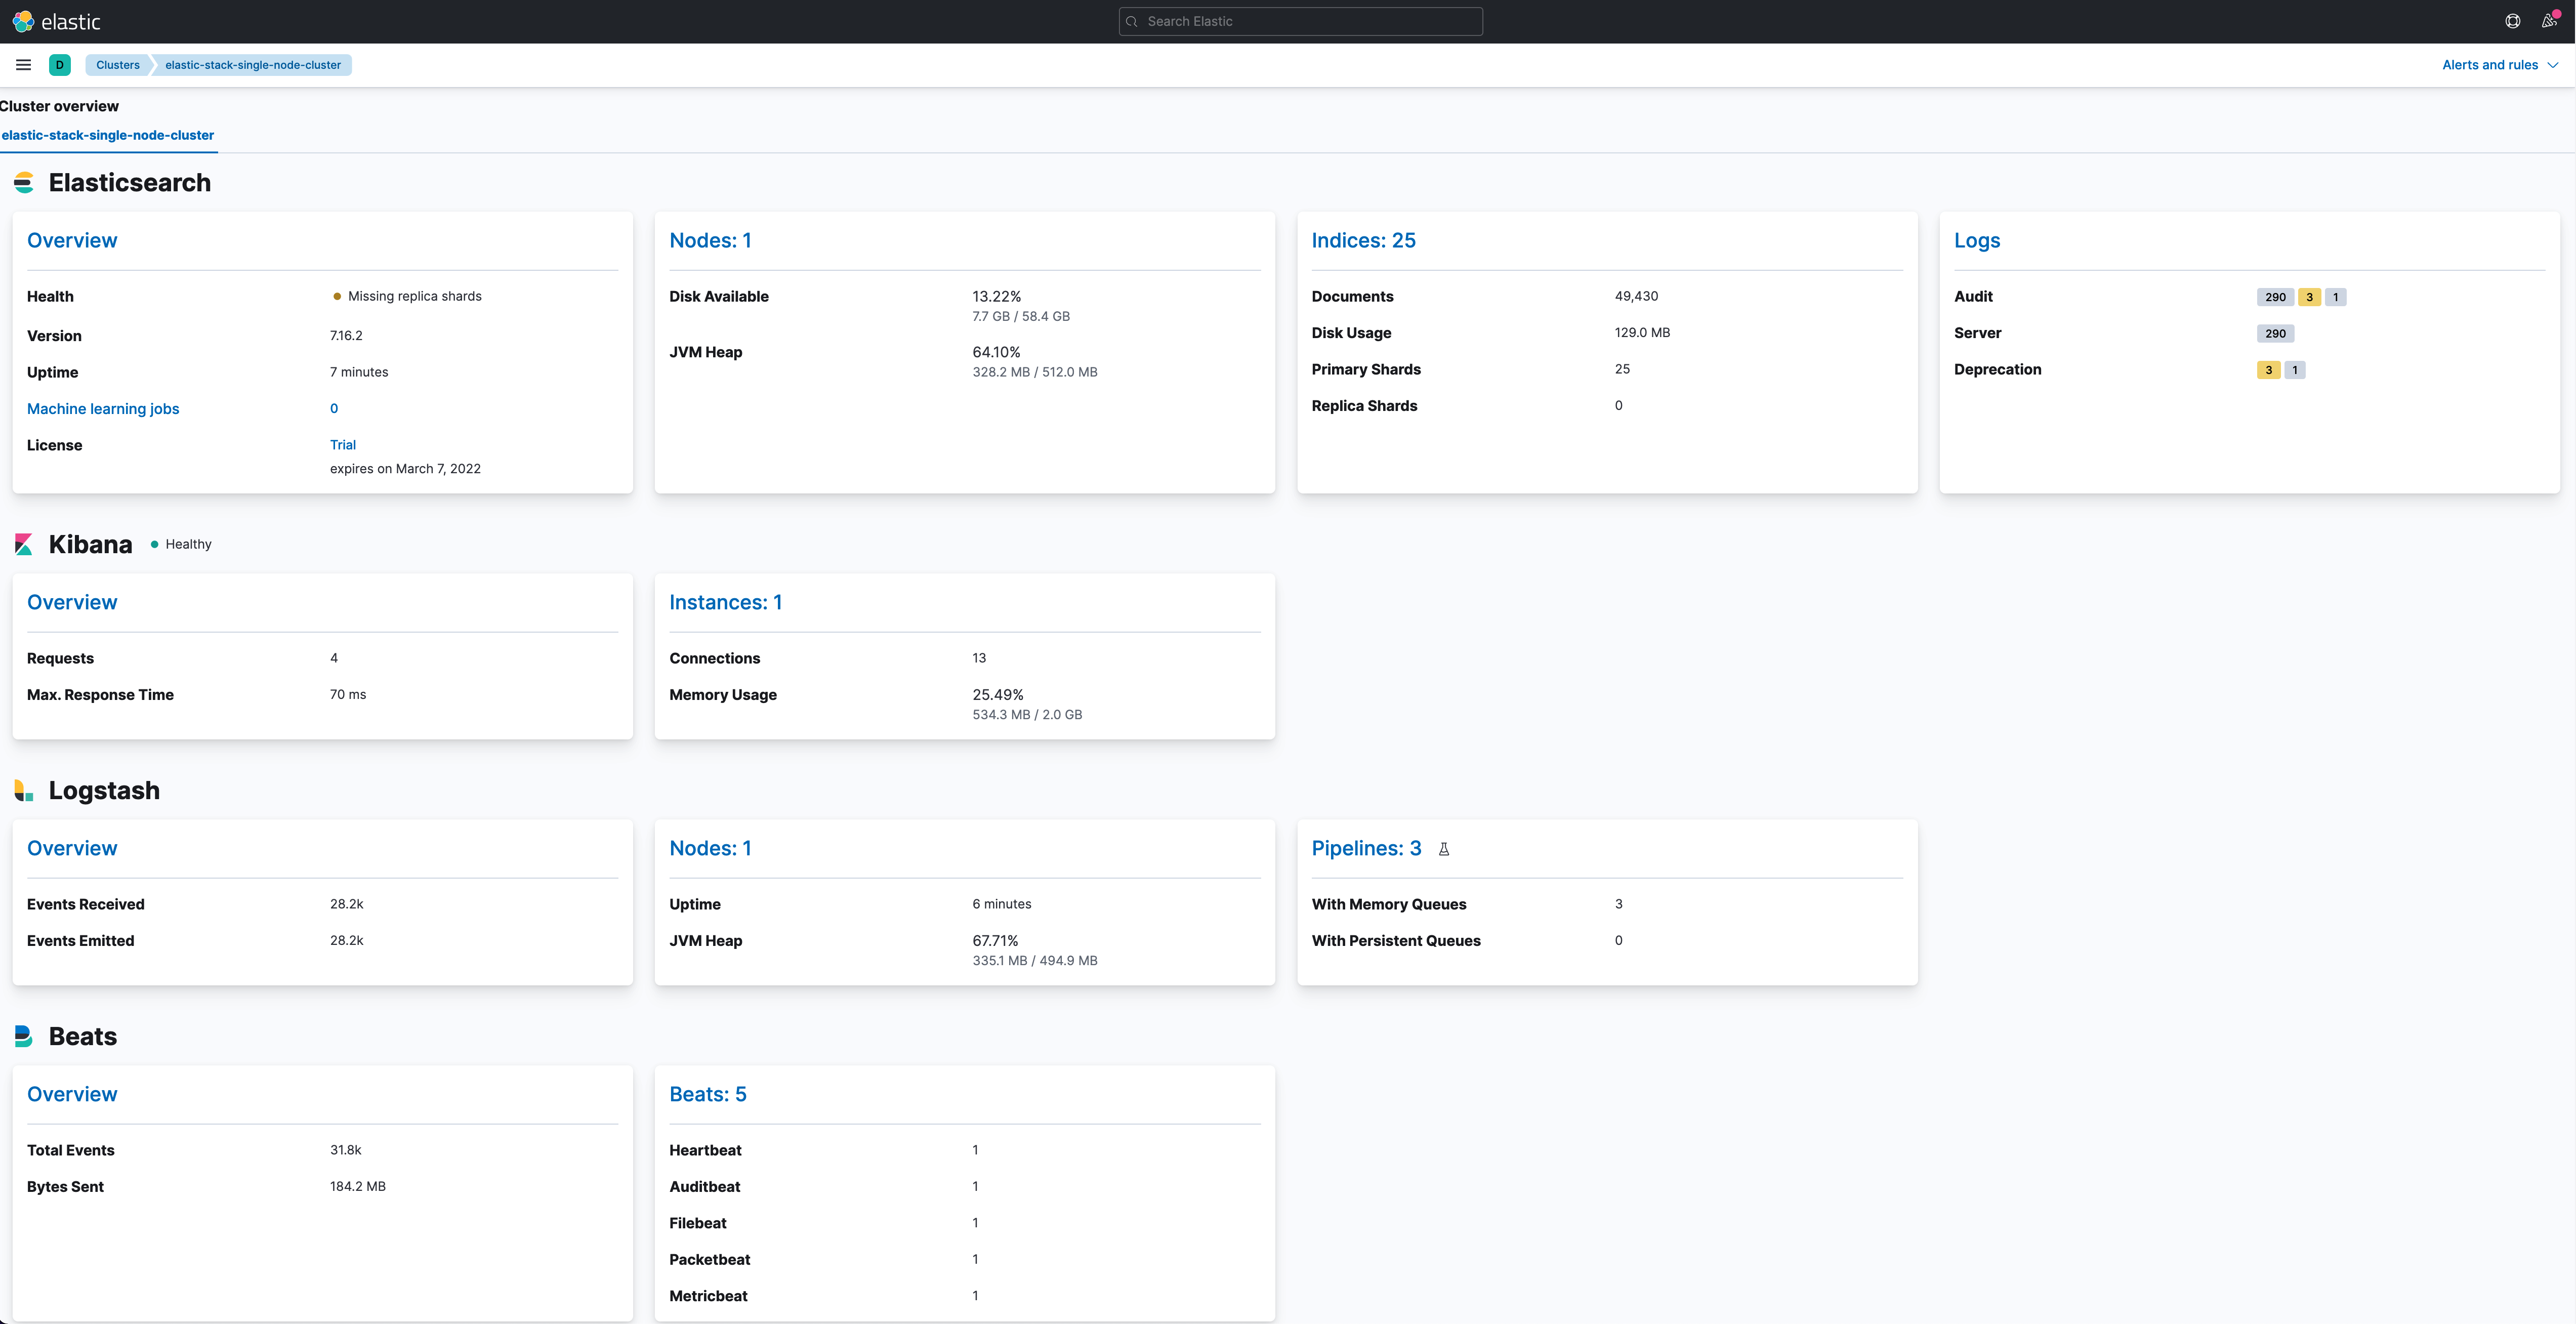
We are finally done deploying all the components of our architecture. If you go to Management > Stack Monitoring, you can see the status of your cluster. It is quite a complet one, as we are monitoring almost every aspect of it.
Now go to Analytics > Dashboards and look for a dashboard called [Auditbeat System] System Overview ECS. Click it and you will see an overview of the network’s metrics:
![CANCHITO-DEV: [Auditbeat System] System Overview ECS](http://www.canchito-dev.com/public/blog/wp-content/uploads/2022/02/auditbeat_system_dashboard_system_overview_ecs.png)
Clean Up
To do a complete clean up, execute this command:
$ docker-compose -f docker-compose-es-single-node.yml -f docker-compose-filebeat-to-elasticseach.yml -f docker-compose-filebeat-to-logstash.yml -f docker-compose-logstash.yml -f docker-compose-metricbeat.yml -f docker-compose-heartbeat.yml -f docker-compose-packetbeat.yml -f docker-compose-auditbeat.yml down -v
Summary
In this post, we learn about Auditbeat and how it can be deployed within a dockerized enviroment. Once deployed, Auditbeat can help you, by auditing the activities of users and processes on your systems, detect changes to critical files, and identify potential security policy violations.
Please feel free to contact us. We will gladly response to any doubt or question you might have. In the mean time, you can download the source code from our official GitHub repository.